By Joshua Blumenfeld, EOSDIS / NASA EarthData

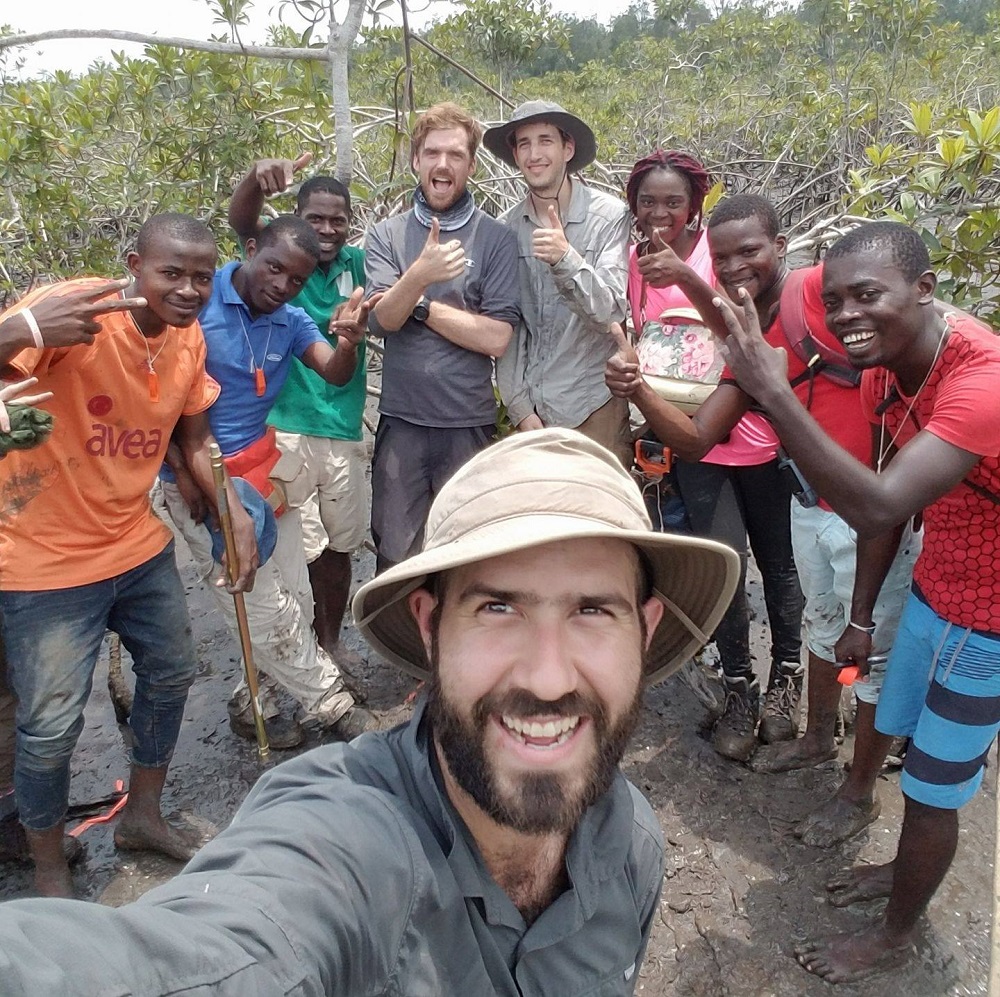
Dr. Lagomasino is a Research Scientist and Assistant Professor of Coastal Studies at East Carolina University in North Carolina. He uses a combination of field data, environmental data, and remotely-sensed observations to study the impacts of human and natural disturbances on coastal ecosystems and the responses of the coastal landscape (both on land and under the sea) to these pressures.
Research Highlights: Vegetation living in coastal environments face a never-ending struggle of surviving highly saline water, constantly shifting sediments, and periodic destructive storms. That mangroves thrive in these conditions is a testament to not only their adaptability, but also their sheer resiliency.
Comprising shrubs or trees that grow in coastal saline or brackish water, coastal mangrove forests occupy a relatively small global ecological footprint. However, these biomes are some of the most ecologically diverse areas on Earth and the foundation of the coastal food web. As scientists like Dr. David Lagomasino are quick to point out, mangrove forests are important ecosystems for maintaining the planet’s health through their work as carbon sinks.
Dr. Lagomasino’s research focus is on coastal ecosystems and global coastline change, and mangrove forests figure prominently in his work. Understanding the structure and function of coastal systems is critical for determining their health and development. Remotely-sensed data products that are freely available through NASA’s Earth Observing System Data and Information System (EOSDIS) help enable him to conduct research on a global scale.
A principal EOSDIS source for Dr. Lagomasino’s data is NASA’s Oak Ridge National Laboratory Distributed Active Archive Center (ORNL DAAC). A partnership between NASA and the U.S. Department of Energy, NASA’s ORNL DAAC is responsible for EOSDIS data related to biogeochemical dynamics, ecology, and environmental processes.
In particular, Dr. Lagomasino relies on ORNL DAAC-distributed datasets that are part of the NASA Carbon Monitoring System (CMS). This is not surprising since mangrove forests are one of the most carbon-dense ecosystems in the world and, as noted by the Smithsonian Institution, a critical component in mitigating climate change. According to a recent study, global mangrove forests are estimated to contain as much as 6.4 petagrams of carbon (PgC) in the top meter of soil (for perspective, one petagram is equal to one billion metric tons). As Dr. Lagomasino observes, the loss of coastal wetlands has the potential to release high concentrations of carbon dioxide (CO2) through the loss of soils. In fact, the above-mentioned study attributes the loss of mangrove forests between 2000 and 2015 to the release of up to 122 million tons of carbon as the soils and biomass in which this carbon was stored were disturbed or destroyed.
Using remotely-sensed data from a number of satellite-borne instruments, Dr. Lagomasino was the lead author on a CMS dataset providing estimates of mangrove extent for 2016 and mangrove change (gain or loss) from 2000 to 2016 in major river delta regions of six countries: Gabon, Jamaica, Mozambique, Peru, Senegal, and Tanzania. The Mangrove Forest Cover Extent and Change across Major River Deltas, 2000-2016, dataset (doi: 10.3334/ORNLDAAC/1670) is available through NASA’s ORNL DAAC.
While mangrove forest habitat loss can be due to human factors, such as water diversion, deforestation, and the destruction of mangroves for the development of shrimp farms, natural disasters also take a toll on these vital ecosystems. During tropical storms, coastal mangroves help buffer inland communities from strong winds and storm surges. However, mangroves can be severely damaged by these storms even as they help alleviate their impact.
The extremely strong 2017 Atlantic hurricane season, for example, caused tremendous damage to mangrove forests across the Caribbean. Dr. Lagomasino was part of a research team that used a combination of remotely-sensed data from multiple platforms to examine the effects of these storms on mangrove forest degradation and canopy structure.
An important sensor-derived measurement used by the research team to assess mangrove health was the Normalized Difference Vegetation Index, or NDVI. NDVI is calculated from the difference between visible and near-infrared light reflected by vegetation. Healthy vegetation absorbs most of the visible light that hits it and reflects a large portion of light in near-infrared wavelengths. Unhealthy or sparse vegetation absorbs more near-infrared light and reflects more light in the visible spectrum. These differences in reflectance can easily be detected by multispectral instruments such as the Moderate Resolution Imaging Spectroradiometer (MODIS) aboard NASA’s Terra and Aqua satellites or the Enhanced Thematic Mapper+ (ETM+) and Operational Land Imager (OLI) instruments aboard the joint NASA/USGS Landsat series of satellites.
Based on NDVI data, Dr. Lagomasino and his colleagues found that 30 times more mangrove areas were damaged in 2017 than in the previous eight hurricane seasons. NDVI data also indicated that a majority of this vegetation damage persisted for at least seven months after the end of the hurricane season.
To determine mangrove canopy height during the study, Dr. Lagomasino and his colleagues used high-resolution airborne LIDAR data. LIDAR, an acronym for light detection and ranging, is a remote-sensing technique that uses laser pulses to precisely map ground elevation. The research team relied on data collected from a NASA airborne system called Goddard’s LIDAR, Hyperspectral & Thermal Imager (G-LiHT). G-LiHT collects multiple measurements simultaneously, including LIDAR-derived vegetation height and high-resolution photographs.
Following Hurricane Irma (August 30 to September 12, 2017), Dr. Lagomasino was part of a team of researchers from NASA’s Goddard Space Flight Center in Greenbelt, MD, Florida International University, the University of Maryland, and Everglades National Park that examined the extent of mangrove mortality in the Florida Keys and Everglades National Park. Using pre- and post-hurricane G-LiHT and NDVI data combined with satellite imagery, the team was able to build predictive models of the research area to assess the change in vegetation over time.
The team used two primary assessments. G-LiHT LIDAR data were analyzed for changes in forest structure, while re-greening of vegetation was analyzed using Landsat imagery acquired every 16 days after Irma. The areas that received damage and that did not re-green were considered the most impacted, and covered a significant portion of the forest. As Dr. Lagomasino points out, though, areas that did not re-green following the hurricane may not have been healthy to begin with.
Along with being included in airborne systems like G-LiHT, LIDAR also is carried aboard satellites. The Advanced Topographic Laser Altimeter System (ATLAS) LIDAR aboard NASA’s Ice, Cloud, and land Elevation Satellite-2 (ICESat-2) spacecraft (launched in September 2018) fires 10,000 laser pulses per second to precisely map Earth’s elevation (compared with 40 pulses per second in the original ICESat laser). About 20 trillion photons leave ATLAS with each pulse and about a dozen photons make the 3.3 millisecond return trip for detection by the satellite’s 2.6-foot diameter beryllium telescope. When this travel time is combined with the satellite’s GPS and star trackers, ICESat-2 can measure surface height to a precision of about one inch (about the length of a standard paperclip).
In an ongoing NASA-funded research project, Dr. Lagomasino is part of a multi-national team using ICESat-2 ATLAS data to estimate mangrove canopy height and tidal levels in coastal wetlands, provide shallow water bathymetry data for seagrass and coral reef mapping, and produce maps of coastal zone ecosystem structure. The project is examining coastal ecosystems around the world, including in the Gulf of Mexico, the Caribbean, Ecuador, Venezuela, Columbia, French Guyana, Mozambique, and Tanzania.
As Dr. Lagomasino’s research shows, the damage to coastal mangrove ecosystems from both human and environmental impacts has implications far beyond the limited ecological extent of these areas. From assessing vegetative health to tracking the tremendous amounts of carbon released as these vital ecosystems are damaged or degraded, sensors aboard Earth observing satellites are providing the spatial and temporal data that help enable his studies.
References:
Taillie, P., Roman-Cuesta, R., Lagomasino, D., Cifuentes-Jara, M., Fatoyinbo, T.L., Ott, L.E. & Poulter, B. (2020). “Widespread mangrove damage resulting from the 2017 Atlantic mega hurricane season.” Environmental Research Letters, 15(6) [doi: 10.1088/1748-9326/ab82cf].
Lagomasino, D., Fatoyinbo, T., Lee, S., Feliciano, E., Trettin, C., Shapiro, A. & Mangora, M.M. (2019). “Measuring mangrove carbon loss and gain in deltas.” Environmental Research Letters, 14(2) [doi: 10.1088/1748-9326/aaf0de].
Zhang, C., Durgan, S.D. & Lagomasino, D. (2019). “Modeling risk of mangroves to tropical cyclones: A case study of Hurricane Irma.” Estuarine, Coastal and Shelf Science, 224: 108-116 [doi: 10.1016/j.ecss.2019.04.052].
Fatoyinbo, T., Feliciano, E.A., Lagomasino, D., Lee, S.K. & Trettin, C. (2018). “Estimating mangrove aboveground biomass from airborne LIDAR data: a case study from the Zambezi River delta.” Environmental Research Letters,13(2) [doi: 10.1088/1748-9326/aa9f03].
Ramsayer, K. (2018). “NASA Mapping Hurricane Damage to Everglades, Puerto Rico Forests.” NASA’s Goddard Space Flight Center, Greenbelt, MD. Published April 13, 2018. Available online at https://go.nasa.gov/2Xizfuk.
Sanderman, J., et al. (2018). “A global map of mangrove forest soil carbon at 30 m spatial resolution.” Environmental Research Letters,13(5) [doi: 10.1088/1748-9326/aabe1c].
Lagomasino, D., Fatoyinbo, T., Lee, S., Feliciano, E., Trettin, C. & Simard, M. (2016). “A Comparison of Mangrove Canopy Height Using Multiple Independent Measurements from Land, Air, and Space.” Remote Sensing, 8(4): 327 [doi: 10.3390/rs8040327].


