
By Joshua Blumenfeld, EOSDIS / NASA EarthData
Deforestation is taking a toll on the Amazon and other areas of high biodiversity.
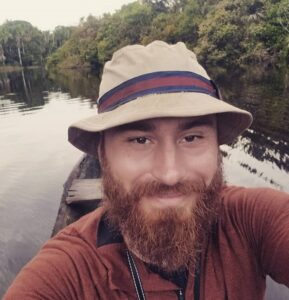
Dr. Eric Bullock, a Post-Doctoral Researcher at the Center for Remote Sensing at Boston University, uses Earth observation data to explore the consequences of land use and land cover change in these areas.
Research interests: Using remotely-sensed data to address issues related to land cover and land use change, including the role of forest disturbance in the terrestrial carbon cycle, the resiliency of mangroves to climate change, the effectiveness of protected areas, and applications for international greenhouse gas reporting mechanisms.
Research highlights: The city of Iquitos, Peru, sits hard against the Amazon rainforest. Accessible only by boat or air, this city of nearly 500,000 people has for centuries been a gateway to the Amazon. Its location along the Amazon River facilitates the flow of timber, oil, rubber, and other natural resources out of one of the most biodiverse regions on Earth.
For additional resources related to biological diversity and ecological forecasting, explore NASA EarthData’s new biodiversity data pathfinder and toolkit.
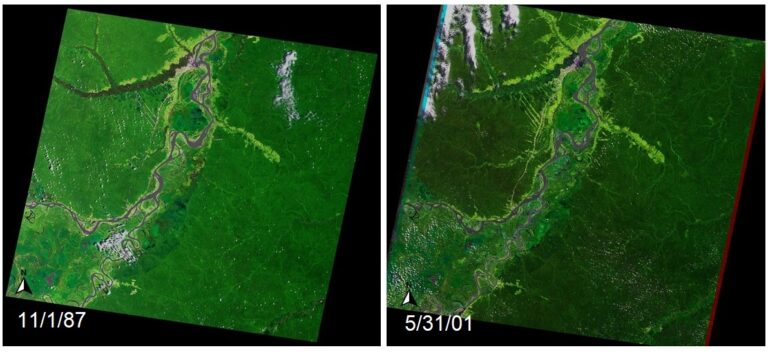
Until the late-20th century the Amazon was able to push back. Its lack of accessibility limited deforestation in Peru to roughly 0.2 to 0.4 percent annually, according to the Global Forest Atlas. By the start of the 21st century, though, an illegal timber trade had exploded and deforestation is increasing.
These disturbances to the Amazon are also leading to changes in this vast region’s ecology that can be tracked by instruments aboard Earth observing satellites.
Disturbances such as openings in the understory from deforestation that allow new plant species to move in and shifts in reflectance as green vegetation is replaced with brown earth can be detected from space. As Dr. Eric Bullock notes, remotely-sensed data enable the detection and monitoring of subtle changes in forest ecosystems.
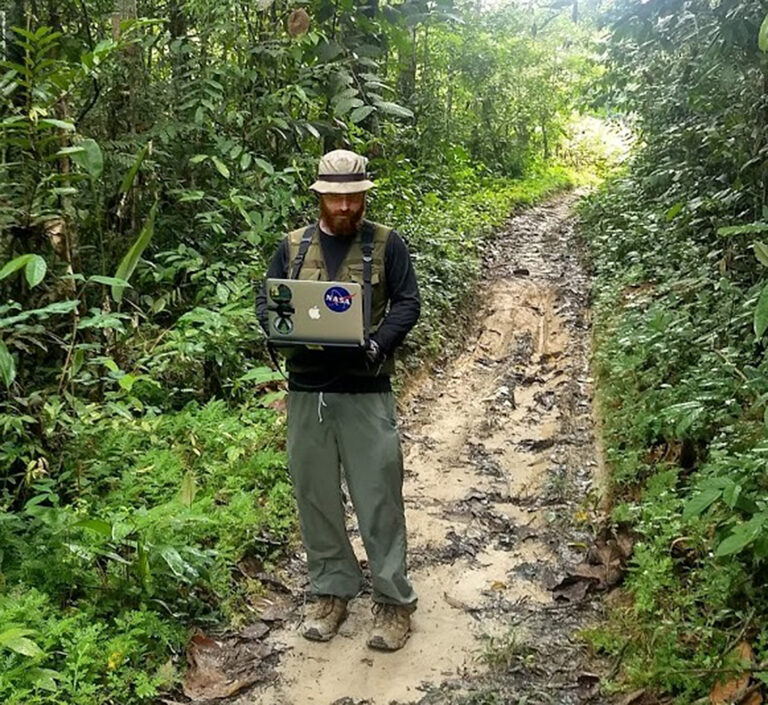
In his research into land use change and the role of tropical forests in the global carbon cycle, Dr. Bullock relies on data in NASA’s Earth Observing System Data and Information System (EOSDIS) collection. His primary source for these EOSDIS data is NASA’s Land Processes Distributed Active Archive Center (LP DAAC). LP DAAC is a partnership between NASA and the USGS, and provides tools and services for discovering and analyzing EOSDIS data related to areas including land cover and land use. LP DAAC is part of the USGS Earth Resources Observation and Science (EROS) Center in Sioux Falls, SD, which distributes data from the joint NASA/USGS Landsat series of satellites that Dr. Bullock also incorporates in his research.
Using Landsat data, Dr. Bullock developed the open source Continuous Degradation Detection (CODED) algorithm for mapping tropical forest degradation and deforestation using time series analysis of Landsat data. The motivation behind the CODED project was to develop a methodology that could successfully identify low-magnitude forest disturbances and help better differentiate between deforestation and degradation.
When applying the CODED methodology to the Amazon Ecoregion, Dr. Bullock and his colleagues found that since 1995 approximately the same amount of forest has been affected by degradation as has been affected by deforestation due to causes such as fire and selective logging. Consequently, the research team found that the Amazon is 44 to 60 percent more disturbed than previously reported, corresponding to unaccounted carbon emissions and damage to critical ecosystems.
Dr. Bullock is piloting the CODED methodology for use as part of the United Nations Reducing Emissions from Deforestation and Degradation in Developing Countries (REDD+) program (the “+” stands for “plus the sustainable management of forests, and the conservation and enhancement of forest carbon stocks”).
![]()
REDD+ is a United Nations initiative created to reduce emissions from deforestation and forest degradation, and offers financial incentives for developing countries to reduce emissions from forested lands and invest in low-carbon paths to sustainable development. REDD+ activities are taking place in 64 countries, and Dr. Bullock has taught his CODED methodology in South America, Africa, and Southeast Asia in support of REDD+ activities.
Dr. Bullock also utilizes near real-time (NRT) data in his work. He was part of a team that used daily data acquired by the Moderate Resolution Imaging Spectroradiometer (MODIS) instrument aboard NASA’s Terra (launched in 1999) and Aqua (launched in 2002) Earth observing satellites to create automated NRT alerts for new areas of deforestation. This is an important element in deforestation monitoring since, as the research team notes, rapid detection of deforestation events is vital for preventing future forest losses and for mitigating the negative effects of deforestation, such as increased carbon emissions, detrimental environmental impacts, and the endangerment of native and local communities.
NASA’s EOSDIS provides access to numerous NRT products, including MODIS NRT products, through NASA’s Land, Atmosphere Near real-time Capability for EOS (LANCE). Since MODIS acquires full global data and imagery every one-to-two days, it provides excellent spatial and temporal coverage. Its frequency of coverage also ensures enough cloud-free images to enable rapid assessment and comparison of specific areas of interest over days, months, or years.
Dr. Bullock and his colleagues created two algorithms using MODIS data. The first algorithm, NRT-Continuous Change Detection and Classification (NRT-CCDC), is based on an existing CCDC algorithm using MODIS data that has been used for land cover monitoring in New England, China, and Columbia.
The research team modified the CCDC algorithm to focus on NRT disturbance detection, with detected disturbances labeled as low-probability, high-probability, or confirmed based on the number of consecutive observations exceeding a change threshold, with an alert triggered for detected low- and high-probability disturbances.
The second algorithm, called Fusion2, utilizes daily Terra and Aqua MODIS observations to rapidly detect disturbance using a model based on a time series of Landsat observations.
The research team found that both the NRT-CCDC and Fusion2 algorithms showed higher performance detecting large deforestation events than small events and that the Fusion2 algorithm detects forest disturbance slightly more rapidly than the NRT-CCDC algorithm.
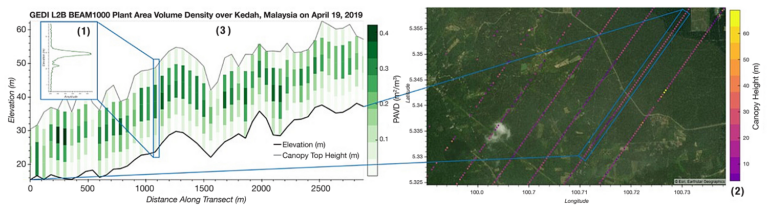
New data relevant to land use and land cover studies are constantly being added to the EOSDIS collection, and Dr. Bullock has started working with recently-released data from NASA’s Global Ecosystem Dynamics Investigation (GEDI) mission to the International Space Station.
Led by the University of Maryland in collaboration with NASA’s Goddard Space Flight Center in Greenbelt, MD, GEDI launched on December 5, 2018, and is installed on the space station’s Japanese Experiment Module-Exposed Facility (JEM-EF).
GEDI is producing high-resolution laser ranging observations of Earth in order to characterize the effects of climate change and land use on ecosystem structure and dynamics. GEDI data are acquired using a light detection and ranging (LIDAR) laser system that uses laser beam pulses to measure the distance of objects from the laser. When paired with a global positioning system (GPS) receiver, these data can be used to create extremely accurate 3D measurements of Earth.
As noted in a recent NASA Earthdata article, GEDI data will help further refine our understanding of the carbon cycle and atmospheric concentrations of carbon dioxide (CO2), and help identify and provide a better understanding of how physical disturbances affect ecosystems and carbon storage. Lower-level (Level 1 and 2) GEDI data currently are available through NASA’s LP DAAC; higher-level (Level 3 and 4) GEDI products soon will be available through NASA’s Oak Ridge National Laboratory DAAC (ORNL DAAC). ORNL DAAC is a partnership between NASA and the U.S. Department of Energy, and is responsible for EOSDIS data related to biogeochemical dynamics, ecology, and environmental processes.
As Dr. Bullock and his colleagues continue their research into the ecological impacts of deforestation and forest degradation and the challenges of land use changes in the Amazon and other ecoregions, Earth observing satellites also continue their silent journey collecting the remotely-sensed data that help enable this work. Through NASA’s EOSDIS, these data are only a mouse-click away.
Representative data products used:
Available through NASA’s LP DAAC:
Terra/MODIS Surface Reflectance Daily L2G Global 250 m SIN Grid (doi: 10.5067/MODIS/MOD09GQ.006)
Aqua/MODIS Surface Reflectance Daily L2G Global 250 m SIN Grid (doi: 10.5067/MODIS/MYD09GQ.006)
Terra/MODIS Vegetation Indices 16-Day L3 Global 250 m SIN Grid (doi: 10.5067/MODIS/MOD13Q1.006)
Aqua/MODIS Vegetation Indices 16-Day L3 Global 250 m SIN Grid (doi: 10.5067/MODIS/MYD13Q1.006)
GEDI L2B Canopy Cover and Vertical Profile Metrics Data Global Footprint Level (doi: 10.5067/GEDI/GEDI02_B.001)
Landsat Collection 1, various datasets; available through the USGS EROS Center and the USGS EarthExploreronline search, discovery, and ordering tool
Read about the research:
Bullock, E.L., Woodcock, C.E., Souza Jr., C. & Olofsson, P. (2020). “Satellite‐based estimates reveal widespread forest degradation in the Amazon.” Global Change Biology, 26(5): 2956-2969 [doi: 10.1111/gcb.15029].
Bullock, E.L., Woodcock, C.E. & Holden, C.E. (2020). “Improved change monitoring using an ensemble of time series algorithms.” Remote Sensing of Environment, 238: 111165 [doi: 10.1016/j.rse.2019.04.018].
Tang, X., Bullock, E.L., Olofsson, P., Estel, S. & Woodcock, C.E. (2019). “Near real-time monitoring of tropical forest disturbance: New algorithms and assessment framework.” Remote Sensing of Environment, 224: 202-218 [doi: 10.1016/j.rse.2019.02.003].
Bullock, E.L., Woodcock, C.E. & Olofsson, P. (2018). “Monitoring tropical forest degradation using spectral unmixing and Landsat time series analysis.” Remote Sensing of Environment, 238: 110968 [doi: 10.1016/j.rse.2018.11.011].


