

Dr. Erin Conlisk is a quantitative ecologist at Point Blue Conservation Science in Petaluma, CA. Here is what Erin shared with us about the work she presented on Tuesday, Dec. 10 at #AGU19:
Forecasting Wetland Habitat to Support Multi-Species Management Decisions in the Central Valley of California
What are the major findings of this research?
To predict waterbird habitat, we built two types of models: (i) models built on the average (across 2001-2017) availability of surface water and (ii) models built on the real-time availability of surface water at the time birds were observed. Because both types of models performed equally well, they can be used for different purposes; the former can be used to prioritize long-term conservation decisions (e.g. buying land for nature reserves) and the latter can be used for temporary intervention (e.g. seasonal irrigation to augment existing waterbird habitat).
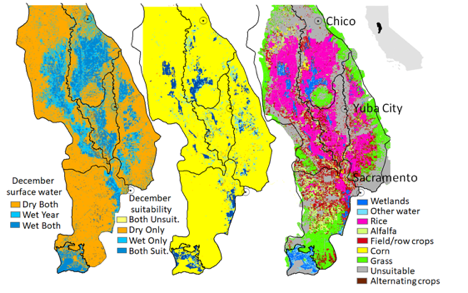
Using the strengths of the second type of model, we compared waterbird habitat suitability from September to April in the wettest and driest conditions observed in each month across the time series.
We found that bird habitat is typically lost in dry conditions. This is especially so when those dry conditions occur during what are typically the wettest months of the year (November-February), when waterbird habitat is most plentiful. Further, decreases in habitat are focused in agricultural fields; in contrast, wetlands retain most of their habitat in wet and dry conditions.
What are the implications of your findings?
Our findings suggest that waterbirds respond to both real-time and long-term average surface water conditions, hence the similar performance between the two types of models.
Birds may revisit the same site across multiple years because, in any given month, locations that have frequently been flooded in the past are likely to be flooded in the future.
Other models we have created to predict surface water under clouds demonstrate that the long-term average provides a good first estimate of surface water in this heavily managed region of California.
Our results comparing habitat suitability in wet and dry conditions support the approach taken by our partners, The Nature Conservancy, of focusing habitat augmentation in agricultural fields. There is the potential to lose important bird habitat if farmers, in particular rice farmers, do not flood their fields for post-harvest decomposition.
What insight did you gain from NASA/USGS Landsat that would have been difficult to ascertain otherwise?
The frequent landscape-level environmental monitoring provided by Landsat imagery made it possible for us to match the date of bird observation to the contemporaneous, or real-time, surface water conditions at the site. With the ability to make real-time habitat predictions, we were able to compare the extremities of surface water availability to discover when and where suitable habitat may be vulnerable in dry years.
Who will be using the habitat suitability maps that your team has developed?
All of our spatial data and forecasts will be available in an online interface and data download system. Using Point Blue’s WaterTracker platform, we will enable users to select and view the entire archive of spatially-explicit data.
Users will be able to query multiple spatial data sets simultaneously and download the data for a customized spatial extent for use in conservation prioritization software such as Zonation.
We anticipate that the primary user of these resources will be The Nature Conservancy and wetlands managers.
Co-authors:
Kristin B Byrd
U.S. Geological Survey
Nathan Elliott
Point Blue Conservation Science
Austen Lorenz
U.S. Geological Survey
Mark Reynolds
The Nature Conservancy
Greg Golet
The Nature Conservancy
Matthew Edward Reiter
Point Blue Conservation Science
Funding provided by NASA Applied Sciences Ecological Forecasting Program (#NNX17AG81G).
Further Reading:
+ Tracking Water Resources in California’s Central Valley
+ Landsat Helps Feed Tired And Hungry Birds
+ Landsat at the 2019 AGU Fall Meeting
Anyone can freely download Landsat data from the USGS EarthExplorer or the LandsatLook Viewer.


