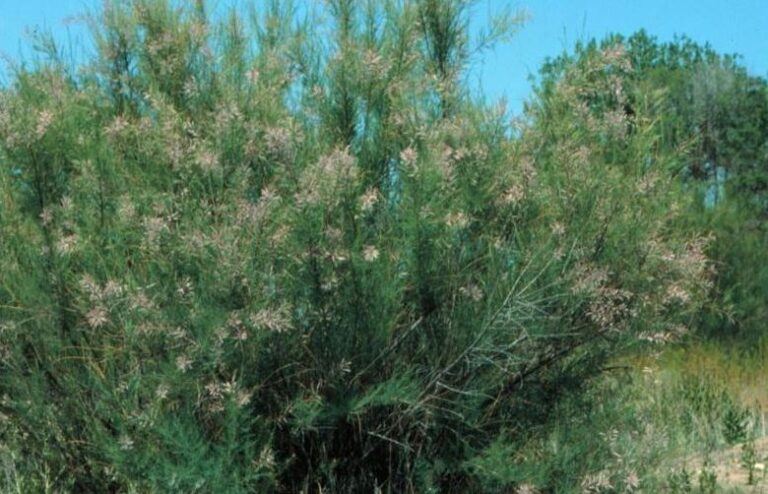
With needle-like leaves and pink flowers that develop in the spring, the small, shrub-like tree called tamarisk (Tamarix spp.) is commonly found on riverbanks in the western United States. Also known as saltcedar, tamarisk was introduced to the U.S. from Eurasia in the late 1800s.
Tamarisk was originally celebrated as a successful species introduction because of its ability to stabilize riverbanks and tolerate drought. But the species has since replaced native vegetation in riparian ecosystems across drier parts of the West, altering the dynamics of these ecosystems. Tamarisk is now the second most common riparian tree in western North America after cottonwood (Populus spp.).
Invasive species like tamarisk cost the U.S. economy about $120 billion a year, according to a 2005 study. The U.S. Geological Survey (USGS) reports that “the current annual environmental, economic, and health-related costs of invasive species exceed those of all other natural disasters combined.”
Because invasives have such a large impact on our economy and environment, many researchers at universities and federal agencies are developing strategies to monitor and control them in order to minimize their damage. Remote sensing has been used increasingly to track invasive species distributions and predict where they might spread.
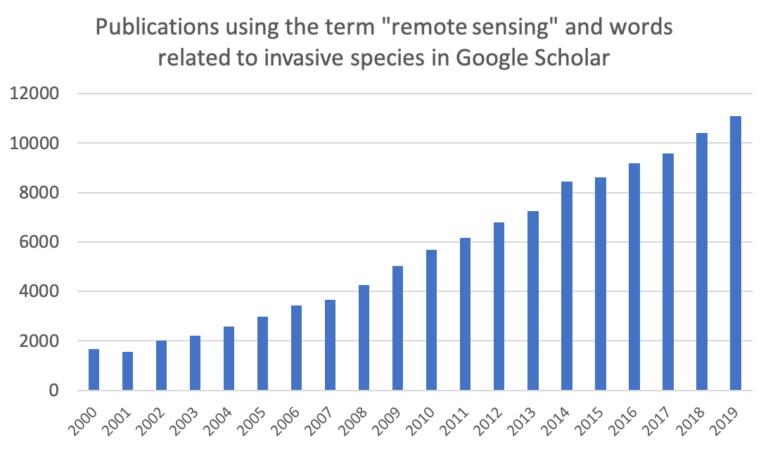
Searching for the term remote sensing and words related to invasive species (invasive, nonnative, exotic, or nonindigenous) in Google Scholar reveals an increasing number of publications each year using these terms.
From Surveys to Sensors
On-the-ground surveys, where researchers directly observe species and their habitats, are essential to understanding the characteristics of invasion. Researchers use field surveys to map the current distributions of invasive species and to determine factors related to their establishment and spread. Surveys are time-consuming, expensive, and can be limited in geographic scope, which is why researchers often rely on remote sensing to aid their work.
Mapping the presence of plants and animals using remote sensing can be done with optical imagery when the species has distinguishing characteristics. For example, large animals or plants with a distinctive presence may be detected using freely-available optical imagery from instruments onboard Landsat (30 m resolution), Moderate Resolution Imaging Spectroradiometer (MODIS, 250–1000 m resolution), or other multispectral instruments.
Airborne instruments have also been used to detect unique differences between plant species. For example, Andrew and Ustin (2008) used the HyMap scanner, an airborne hyperspectral imaging sensor, to identify the unique white flowers of invasive pepperweed (Lepidium latifolium) near Sacramento, California. Similarly, Mitchell and Glenn (2009) used HyMap to identify the yellow bracts of invasive leafy spurge (Euphorbia esula) in southeast Idaho.
Using remote sensing in invasive species research is becoming more prevalent every year, as new data becomes available and researchers are finding different ways to incorporate Earth observations into their work.
Remote sensing data are often used in combination with surveys to map invasive species distribution. These maps help with early detection and focus control efforts.
Mapping Species Distribution
“Mapping species occurrences or where they could potentially spread are two really distinct objectives,” said Paul Evangelista, Research Ecologist at the Natural Resource Ecology Laboratory and Assistant Professor in the Department of Ecosystem Science and Sustainability at Colorado State University.
Evangelista has been studying invasive species for 20 years. For his doctoral work, he used remote sensing data to map where tamarisk had invaded the southwestern U.S. Tamarisk is notoriously difficult to get rid of. Cut it, burn it, even bulldoze it down—it will grow back, which is why early detection of tamarisk is incredibly important.
But directly mapping tamarisk was difficult. Evangelista had to find a way to tell the difference between tamarisk and surrounding native vegetation.
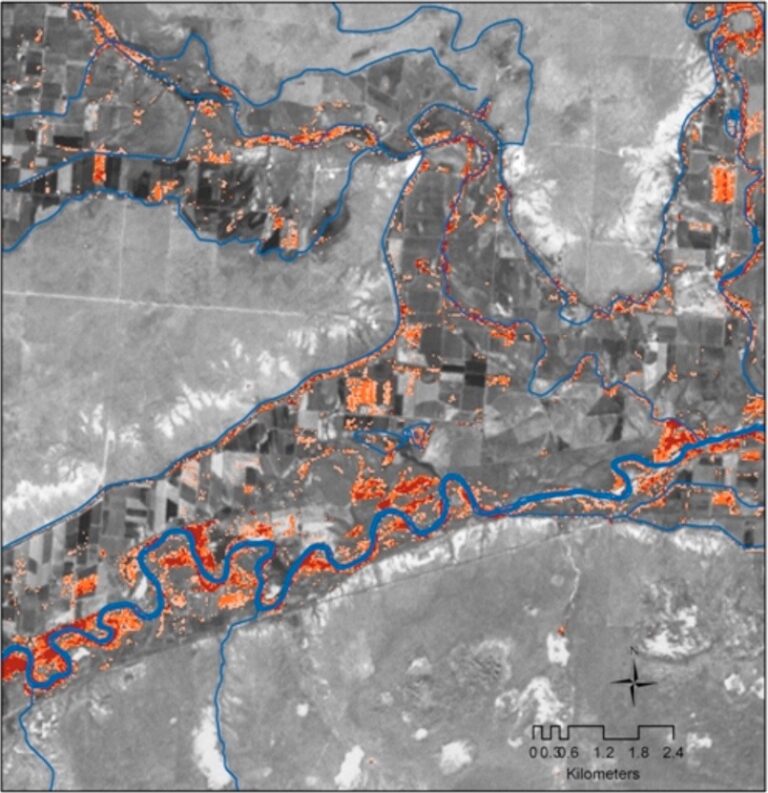
Evangelista’s map of detected tamarisk in southeastern Colorado, along the Arkansas River and irrigation ditches. Tamarisk infestations are shown from moderate (orange) to high (red). This map was published in Remote Sensing in 2009.
“As a field ecologist working in southern Utah, I knew that tamarisk had some distinct features from the native vegetation that could be capitalized on,” said Evangelista. “One of those was that tamarisk would often be one of the first riparian plants to leaf out. It was also one of the last riparian plants to lose its leaves.”
These phenological differences allowed Evangelista to distinguish tamarisk from native species by quantifying differences in normalized difference vegetation index (NDVI) from Landsat 7 Enhanced Thematic Mapper Plus (ETM+) data during the spring and fall.
Vegetation indices such as NDVI are often used in invasive species studies. They can be used to directly detect invasives and can also be used as a proxy for resources, such as food or shelter. For example, a 2013 study that used NDVI data in the MODIS subsetting tool from NASA’s Oak Ridge National Laboratory Distributed Active Archive Center (ORNL DAAC) found that introduced spotted deer (Axis axis) and elephants (Elephas maximus) consumed so much vegetation on the Andaman islands, a chain of islands off the coast of India, that there was a significant reduction in NDVI where the animals were present.
Evangelista is currently advising several projects coordinated through NASA’s DEVELOP program to map invasive species in the U.S. The DEVELOP program is part of NASA’s Applied Sciences Program and it applies the lens of Earth observations to address environmental and public policy issues through interdisciplinary research projects. For one such project, Evangelista advised a team working to map the invasion of cheatgrass (Bromus tectorum) in Medicine Bow National Forest, Wyoming.
Monocultures of cheatgrass have disrupted fire regimes in the western U.S., making fires more frequent and fire seasons longer. The grass is also of little nutritional value to the native mule deer and elk in the forest. Evangelista and colleagues advised the project, which used data from the Landsat 8 Operational Land Imager (OLI) and the European Space Agency’s Sentinel-2 MultiSpectral Instrument (MSI) to create a probabilistic occurrence map of cheatgrass for the year 2019. The Forest Service used this map to spray herbicides in the areas cheatgrass had taken over, and was able to reduce cheatgrass cover in Medicine Bow National Forest.
Preventing the Spread
Mapping where invasives have established is essential to predicting where they might spread. Because tamarisk is very difficult to remove once established, federal agencies and land managers are invested in understanding which places are at risk of invasion. Remotely sensed climate data as well as data on terrain and vegetation are often used to estimate where species could spread.
Evangelista’s colleague Dr. Catherine Jarnevich, a research ecologist at the USGS, developed a habitat suitability map for tamarisk in 2011. Her research showed where tamarisk could spread according to an analysis of 23 environmental parameters, including proximity to water, slope, temperature, and precipitation. “Tamarisk doesn’t grow on a slope,” said Evangelista. “Just knowing this one fact could help you distinguish tamarisk from other species when looking at them from satellite imagery.”
Maps like Jarnevich’s can help raise awareness and prevent the spread of invasives. “Say you have someone working in a state or county park with suitable habitat, but not yet invaded, these maps can help provide an early warning for species that could cause problems in their area,” said Dr. Jeffrey Morisette, chief scientist at the National Invasive Species Council (NISC), which coordinates efforts among 12 federal agencies, including NASA and four White House offices, to control, prevent, and eradicate the spread of invasive species.
“In general, Earth science information coming from NASA provides keen insight into landscape-scale processes that can inform invasive species management. These exciting contributions make NASA an active member of NISC,” Morisette added.
New Data and Technologies
New technological developments and satellite missions have the potential to boost ecological research on invasive species. These new missions provide datasets that can be used to study species habitats and likely distribution, which have applications beyond tracking invasives.
For example, the Global Ecosystem Dynamics Investigation (GEDI) mission, launched in late 2018, uses three lasers to create three-dimensional maps of the world’s forests. In a preliminary study, Burns and colleagues (2020) used simulated GEDI data to predict the probability of occurrence for 25 common bird species in Sonoma County, California. Results from the study suggest that GEDI canopy structure data will improve predictions of bird occurrence. GEDI data could also be used to estimate the abundance of particular species of trees.
New high resolution datasets allow researchers to look at climate and environmental parameters in unprecedented detail, which will in turn allow for finer scale habitat suitability models. Multi-Scale Ultra High Resolution Sea Surface Temperature (MUR SST) data from NASA’s Physical Oceanography DAAC (PO.DAAC), which are now available in the cloud at a 1 km resolution, can provide more information on habitat suitability for aquatic species. For habitats of terrestrial species, NASA’s Soil Moisture Active Passive (SMAP) mission provides global, high-resolution (3 and 9 km) soil moisture data.
References
Ali, R., & Pelkey, N. 2013. Satellite images indicate vegetation degradation due to invasive herbivores in the Andaman Islands. Current Science, 105(2), 209-214. www.jstor.org/stable/24092640
Andrew, M. E., & Ustin, S. L. 2008. The role of environmental context in mapping invasive plants with hyperspectral image data. Remote Sensing of Environment, 112(12), 4301-4317. doi: 10.1016/j.rse.2008.07.016
Burns, P.J., et al. 2020. Incorporating canopy structure from simulated GEDI lidar into bird species distribution models. Environmental Research Letters. doi: 10.1088/1748-9326/ab80ee
Evangelista, P. H., Stohlgren, T. J., Morisette, J. T., & Kumar, S. 2009. Mapping invasive tamarisk (Tamarix): a comparison of single-scene and time-series analyses of remotely sensed data. Remote Sensing, 1(3), 519-533. doi: 10.3390/rs1030519
He, K. S., et al. 2015. Will remote sensing shape the next generation of species distribution models? Remote Sensing in Ecology and Conservation. doi: 10.1002/rse2.7
Jarnevich, C. S., Evangelista, P., Stohlgren, T. J., & Morisette, J. 2011. Improving national-scale invasion maps: tamarisk in the western United States. Western North American Naturalist, 71(2), 164-175. doi: 10.3398/064.071.0204
Mitchell, J. J., & Glenn, N. F. 2009. Subpixel abundance estimates in mixture-tuned matched filtering classifications of leafy spurge (Euphorbia esula L.). International Journal of Remote Sensing, 30(23), 6099-6119. doi: 10.1080/01431160902810620


