Search
Close this search box.

The Curious Case of Missing Mangroves in the Jubail Conservation

The Curious Case of Missing Mangroves in the Jubail Conservation

A new article in Ecological Indicators has helped to solve a case of missing mangroves in Saudi Arabia’s Jubail Conservation (also known as the Jubail Marine Wildlife Sanctuary).

The team of researchers compared mangrove inventories of the Saudi Arabian coast from the years 2000, 2010, and 2014 and noticed that the 2000 inventory indicated a large mangrove habitat within the Jubail Conservation that was not there in the later studies. The 2000 inventory came from the Landsat-derived USGS Mangrove Forest Distribution inventory. This closely-validated dataset is often considered a baseline for mangrove mapping and monitoring.


To figure out if there had been a large loss of mangroves or if something else was going on, the researchers looked at the vegetation’s spectral signature through time. They found that the vegetation signatures for the area of missing mangroves had stayed largely the same from the mid-1980s until today. This led them to the conclusion that the saltmarsh vegetation found in the area today, and documented by field surveys in 2010, was the same vegetation that was there in 2000.

The missing mangroves turned out to be a case of misclassification. The authors’ work will be highly useful for the next iteration of the Mangrove Forest Distribution inventory.

Mangrove Forest Biomass map
These maps show three separate inventories of mangroves along the Saudi Arabian Coast. The first (a) is the USGS Global Mangrove Forest Distribution for year 2000, derived from Landsat data. It shows mapped mangroves in red; the second (b) is the World Atlas of Mangroves inventory from the year 2010 with mangroves shown in blue; and the third map (c) shows the Mangrove Forest Biomass map from the year 2014, with mangrove locations shown in black. The Jubail Conservation is within the dotted-line box. This region has a large discrepancy from 2000 to 2010 and was the crux of the missing mangrove mystery. Did these mangroves die-off, or was there another explanation? Li, El-Askary and a team of researchers used Landsat data to look back in time and solve the mystery. Image credit: Li et al., 2019

We had the opportunity to interview the paper’s first author Wenzhao Li and his PhD advisor and team lead Hesham El-Askary about this work. Below is what they shared with us.

Why did you choose to work with Landsat data for this study?

We chose Landsat data for its ability to provide repetitive and synoptic observations of the Earth.

Since the first launch at 1972, Landsat satellites have taken images of the Earth surface at 16-18 day intervals, making it possible to monitor the mangrove changes over a span of time, in either long or short intervals. It offers higher spatial resolution (30m) than MODIS data, an earlier archive than Sentinel-2 data, and free access (as opposed to most of the commercial satellite images such as WorldView series).

In addition, the Landsat dataset is fully accessible (1982-present) online in the Google Earth Engine, which provides advanced machine learning algorithms for mangrove coverage classification and change detections.

The first goal of this study was to test the accuracy of 2000 USGS mangrove dataset for the Western Arabian Gulf. The most economical way is to compare the Landsat 7 (or 5) images’ spectral reflectance signatures between agreed and questionable mangrove forests. The coherence of the signatures will discern whether the questionable areas are covered with mangrove forests.

You found that for the western Gulf area near Saudi Arabia, that the 2000 USGS Global Mangrove Forest Distribution map (Giri et al., 2011) overestimated mangrove habitats by including some saltmarsh habitat. 

The USGS map has been extensively verified and is considered highly accurate, what do you think may have led to the potential classification errors in your study region?

We firstly compared the USGS maps with the World Atlas of Mangroves (2010) and Global Distribution of Modelled Mangrove Biomass (2014) developed by the Department of Zoology in University of Cambridge. We believe all the sources are considered accurate. However, it was surprising to us when we found that USGS 2000 mangrove map might mistakenly classified the other coastal vegetation types (e.g. saltmarsh) as mangrove in the western Gulf, since the massive mangrove forests marked by USGS [in the Jabail Conservation] did not appear in other maps.
One hypothesis for this finding is that the mangrove forests in the [Jubail Conservation] experienced mass extinction until 2010.

To validate this hypothesis, we tested the spectral reflectance signatures for the selected mangrove samples in the questionable region for a long period of time. We also compared the signatures with those of mangrove regions agreed-upon by all the maps.

The result shows that the questionable mangrove region did experience little changes in the past 30+ years but the vegetation type did not alter much. The typical signatures in the agreed-upon mangrove regions proved that the vegetation in the questionable regions are not mangrove.

Your research involved testing a number of different data classification methods on both a Landsat 7 and 8 image from 2018 to distinguish mangrove habitat. 

After classifying the two scenes multiple times using different methods you compared the accuracy of the results (which method correctly located mangroves) and then used the method that performed best for the rest of your study. That method was Classification and Regression Tress (CART).
 

Can you tell us a bit more about this classification technique and why it works well for classifying mangroves?

The decision tree method based on CART algorithm has been proven to be effective for mangrove mapping (Zhang et al., 2018). This method is known as an expert system and provides a non-parametric discriminating statistical relationship between multiple data layers to produce a binary decision tree. It measures homogeneity according to classes defined by training data, then splits the training data pixels into more homogeneous subsets through recursion.

To classify mangroves over large regions at different periods, the CART decision tree method has shown the ability to obtain classification rules from training samples directly and has the advantage of being independent of the assumptions of value distribution, in contrast to other statistical analysis methods, such as maximum likelihood classification. To distinguish mangroves from other types of land use and to further discuss the factors influencing the mangrove distribution, five land cover types were defined in this study: (1) mangroves, (2) water, (3) tidal flats, (4) terrestrial, (5) other vegetation (such as saltmarshes).

These were mainly based on the consideration of the actual conditions, as well as comparing to the characteristics identified through high spatial resolution images on Google Earth, and ground samples from our collaborators. In this study, we tested different mangrove classification methods including support vector machine (SVM), CART and random forest. The result of using CART to classify land use types achieved highest accuracy as shown by confusion matrices. The classification results also matched our ground truth data from previous field trips. Therefore, the CART decision tree was selected to retrieve the multi-temporal distribution information of mangroves in this study.

For one study location, Abu Ali Island, part of Saudi Arabia’s Jubail Conservation area, you used a recently developed index known as the Submerged Mangrove Recognition Index (SMRI). 

Can you tell us more about this index, its origin, and why it works well for mangrove identification? Are there any challenges associated with its use?

The basic idea is based on the relationship between mangrove forests and tide levels (Xia et al., 2018).

Thanks to the increased abundance of Landsat satellite images, it is becoming progressively easier to collect available images of mangrove habitats captured at low tide and high tide. If we can collect the multi-band Landsat satellite images in high-tide and low-tide of mangrove forests to analyze their difference of spectral signatures, a quantitative spectral index can be designed based on this difference to recognize mangrove forests in tidal zones.

In this paper, we used the SMRI, which highlights the difference between mangrove forests with other land uses, and can comparatively reduce the confusion caused by high tide levels.

Wenzhao Li and his PhD advisor and team lead Hesham El-Askary
Lead author Wenzhao Li and his PhD advisor and team lead Hesham El-Askary, discussing their recent mangrove mapping work. Photo credit: Chapman University
Scientists from King Fahd University of Petroleum and Minerals and the Saudi Wildlife Authority
Scientists from King Fahd University of Petroleum and Minerals and the Saudi Wildlife Authority taking measurements of mangroves on the Saudi Arabian coast. Photo Credit: King Fahd University of Petroleum and Minerals
image and graphs
To solve the mystery of the missing mangroves, Li and his co-authors mapped the spectral signatures of the missing mangrove locations and compared them to areas of consistent mangrove cover. Their results showed that the spectral signature of the missing mangrove area stayed mostly the same (image and graphs on the left) and that these signatures were distinct from the area of consistent mangrove cover (image and graphs on the right). Note that the Landsat 8 bands were mapped to Landsat 5 & 7 numbering; band 6 is the thermal channel and shows brightness temperature; on the Landsat 8 graphs it shows measurements from band 10. The y-axis shows surface reflectance scaled by a factor of 10,000, so 4K represents a reflectance of 0.4 (i.e. 40% reflectance). Image credit: Li et al., 2019
saltmarsh habitats in the Jubail Conservation
Extensive saltmarsh habitats in the Jubail Conservation. Photo credit: Saenger, 2011
saltmarsh vegetation
A closer look at saltmarsh vegetation. Photo credit: Saenger, 2011.
Mohammed Ali B. Qurban, the Director of the Center for Environment & Water at King Fahd University of Petroleum and Minerals, in the field next to a mangrove tree with Mangrove Scientist, Mr. Reynaldo Lindo
Co-author Mohammed Ali B. Qurban, the Director of the Center for Environment & Water at King Fahd University of Petroleum and Minerals, in the field next to a mangrove tree with Mangrove Scientist, Mr. Reynaldo Lindo. Photo credit: King Fahd University of Petroleum and Minerals
A field photo showing mangrove roots
A field photo showing mangrove roots. Photo credit: King Fahd University of Petroleum and Minerals
Submerged Mangrove Recognition Index diagram
The relatively new Submerged Mangrove Recognition Index (SMRI) was created to optimize the identification of submerged mangroves. SMRI highlights the difference between mangrove forests and other land uses, which can comparatively reduce the confusion caused by high tide levels. Image credit: Xia et al., 2018
The Submerged Mangrove Recognition Index (SMRI) formula
The Submerged Mangrove Recognition Index (SMRI)
Mangrove nurseries
Mangrove nurseries have been established around Abu Ali Island by the Ministry of Agriculture. This photo shows planted mangroves that have been sown into polybags and placed close together in the intertidal zone, and then fenced. Photo credit: Saenger, 2011

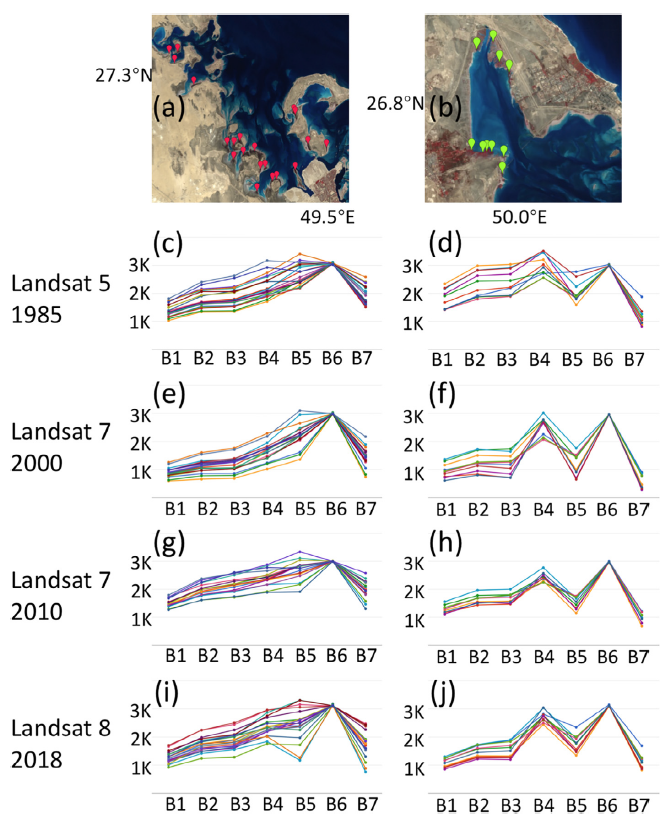
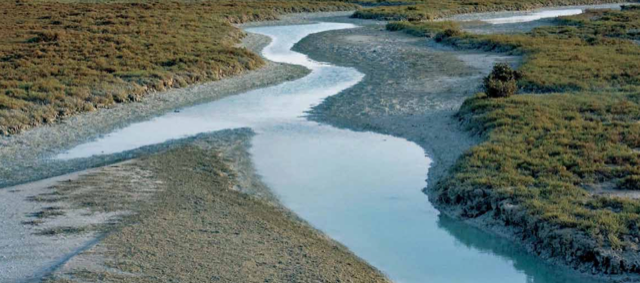
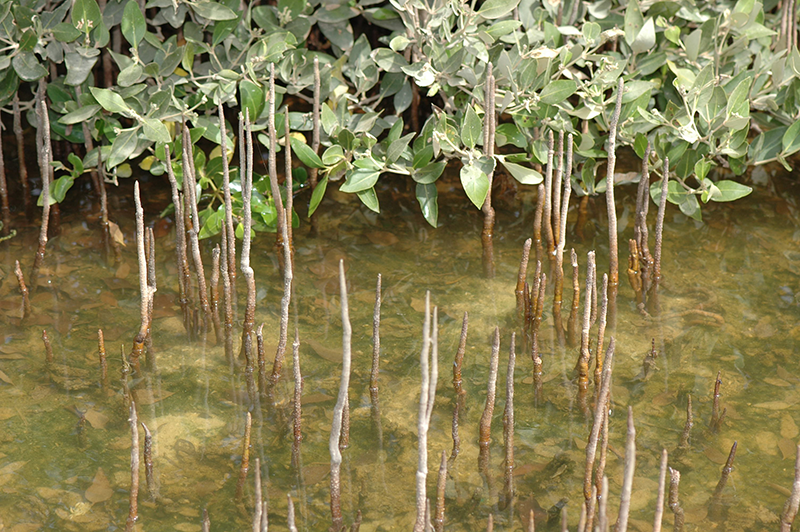
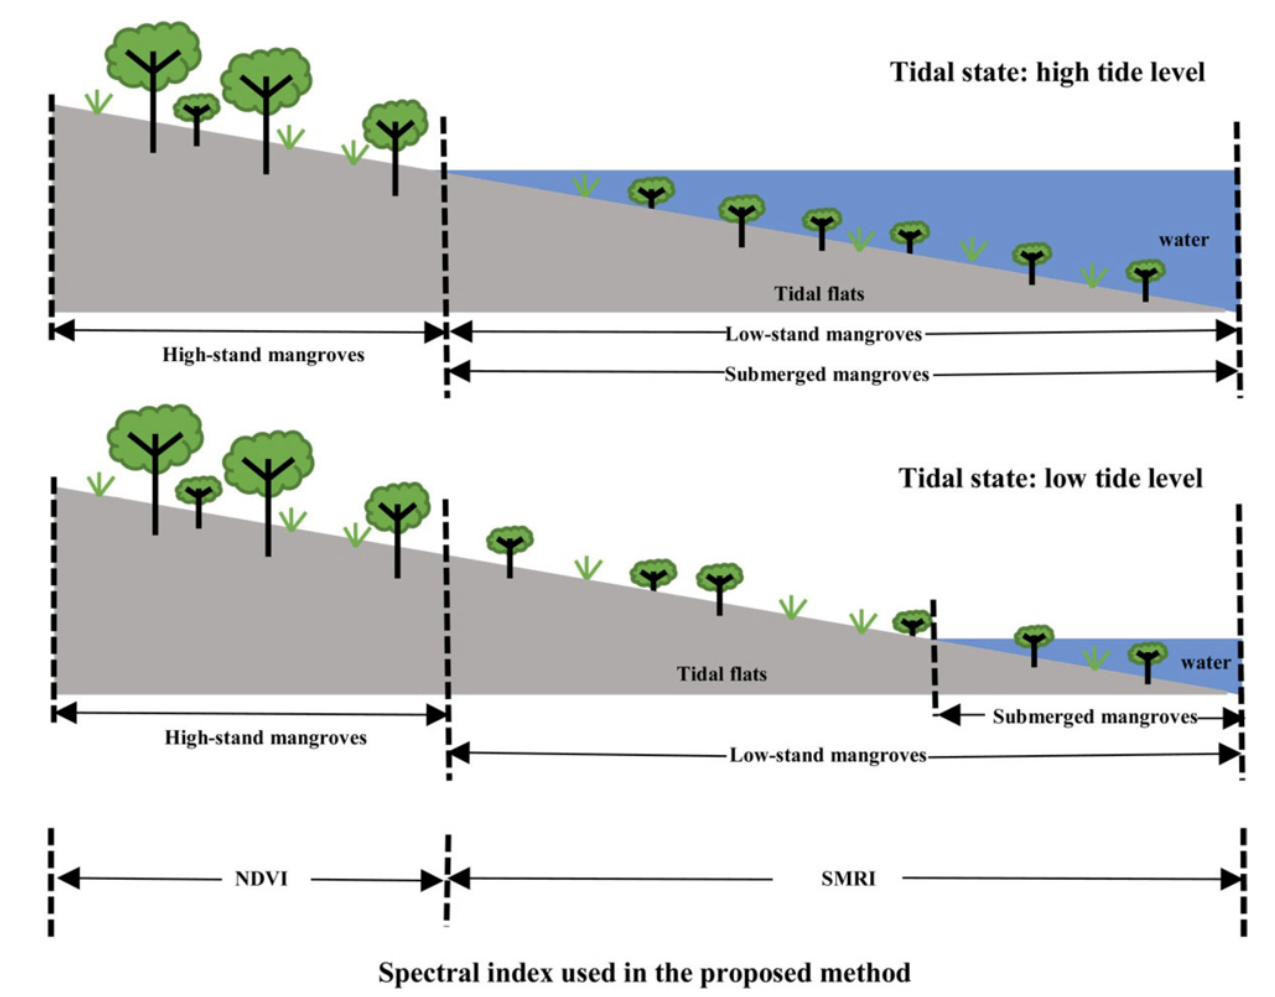
The SMRI works effectively for the regions with sparse mangrove forests (e.g. Western Arabian Gulf) where the land/water could be detected under the mangrove leaves.

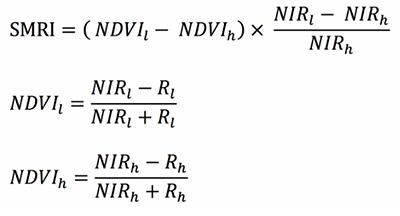
This study collected sparse submerged mangrove samples and calculated their SMRI range (0.2- 0.6) to help with classification. However, SMRI sometimes has a hard time detecting dense mangrove forests. Since the dense mangrove leaves block spectral reflectance from the water surface, which results in little difference between NDVI values in low and high tides scenes, making SMRI close to 0. We believe identifying dense mangrove being submerged by water would require more advanced tools that can provide vertical information, such as LiDAR.

How would you summarize the overall significance of this study?

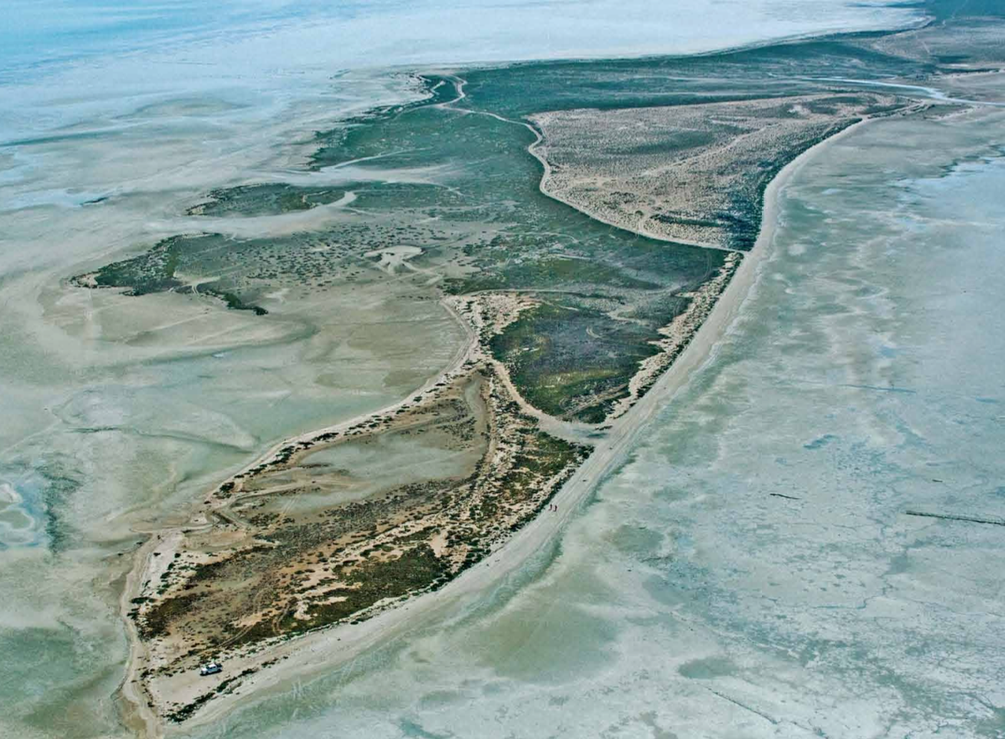
This study found and validated the inaccurate mangroves distribution in the 2000 USGS mangrove dataset over the western Gulf through the spectral analysis over the commonly recognized mangrove areas and from uncertain mangrove areas, which proved that some saltmarsh habitat in the Jubail Conservation in the western Gulf was identified as mangroves.

These results remind researches to be cautious of utilizing this dataset as a baseline in this region, especially for collecting samples for land cover classification for quantitative research purposes.

In addition, this study presents a unique approach of SMRI to detect mangroves with historical Landsat data, using the historical record to address tidal impacts on mangrove mapping and areas estimation over different locations, which could achieve more accurate outcomes of mangrove detection within limited usage of costly high resolution remote sensing imagery.

Do you see your mangrove maps for the western Gulf area being used for mangrove management in any capacity? If so, by who and/or what entity?

One of the primary ecosystem services of mangroves is the regulation of climate by the sequestration of atmospheric carbon, with secondary services contributing to the moderation of extreme weather events such as cyclones and tsunamis. Unfortunately, about 90% of the global mangroves are critically endangered and nearing extinction in almost 26 countries.

International programs, such as the Ramsar Convention on Wetlands or the Kyoto Protocol, emphasize the importance of immediate conservation measures to prevent the further loss of mangroves.

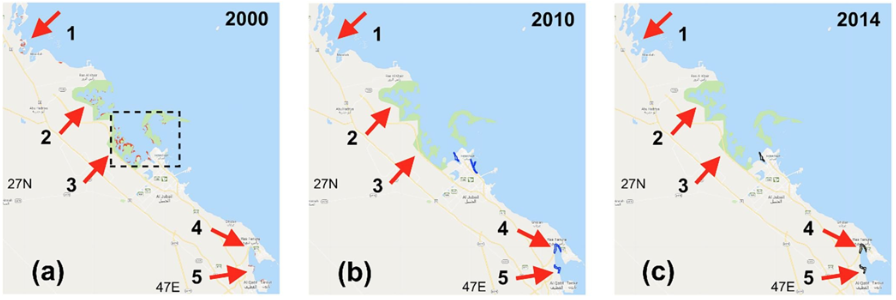
Our mapping techniques build on the historical Landsat record to provide highly needed information on regional scale and this helps in evaluating subtle changes in mangroves over a long period of time (trends) and to detect sudden changes due to natural catastrophes or dramatic anthropogenic impacts.

Landsat imagery coupled with our state-of-the-art smart techniques proved to be useful for the Saudi government and they will use our multi-indices based approach in areas where mangroves are patchy to help in the delineation of mangrove distribution both during low and high tidal regimes.

The Environmental Protection Department of Saudi Aramco and the Center for Environment and Water of KFUPM are working closely with us on the preservation of these marine ecosystems and our mapping techniques will be key in establishing better understanding on how they are affected hence more mitigation strategies will be presented and implemented.

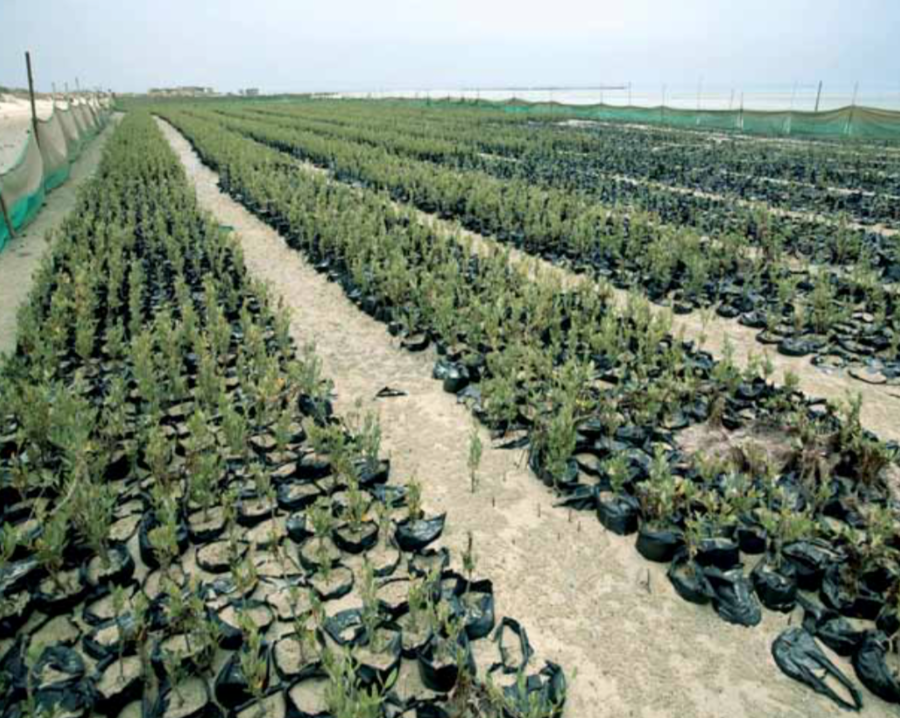
As reported from our collaborators, the several mangrove nurseries/plantations have been established in the Abu Ali island by KSA’s Ministry of Agriculture.

Our study has shown the distributions of these mangrove forest and will be used for mangrove management for monitoring planted mangroves’ health conditions and accurately estimating its expansion (using SMRI to calculate submerged mangrove’s coverage).

Study Authors:

Wenzhao Li
Computational and Data Sciences Graduate Program, Schmid College of Science and Technology, Chapman University

Hesham El-Askary
Center of Excellence in Earth Systems Modeling & Observations and Schmid College of Science and Technology, Chapman University
Department of Environmental Sciences, Faculty of Science, Alexandria University

Mohamed A. Qurban
Center for Environment and Water, The Research Institute, and Geosciences Department, The College of Petroleum Engineering & Geosciences, King Fahd University of Petroleum and Minerals

Jingjing Li
Department of Geosciences and Environment, California State University

K.P. ManiKandan
Center for Environment and Water, The Research Institute, King Fahd University of Petroleum and Minerals

Thomas Piechota
Schmid College of Science and Technology, Chapman University

Full Paper Reference:

Li, Wenzhao, Hesham El-Askary, Mohamed A. Qurban, Jingjing Li, K. P. ManiKandan, and Thomas Piechota. 2019. “Using multi-indices approach to quantify mangrove changes over the Western Arabian Gulf along Saudi Arabia coast.”Ecological Indicators 102:734-745. doi: https://doi.org/10.1016/j.ecolind.2019.03.047.

Additional References:

Saenger, P, 2011, Mangroves and salt marshes, in R Loughland & KA Al-Abdulkader (eds), Marine atlas – Western Arabian Gulf, Saudi Aramco, Dhahran, Saudi Arabia, pp. 78-115.

Xia, Q.; Qin, C.-Z.; Li, H.; Huang, C.; Su, F.-Z. Mapping Mangrove Forests Based on Multi-Tidal High-Resolution Satellite Imagery. Remote Sensing 2018, 10, 1343.

Zhang, X.; Treitz, P.M.; Chen, D.; Quan, C.; Shi, L.; Li, X. Mapping mangrove forests using multi-tidal remotely-sensed data and a decision-tree-based procedure. Int. J. Appl. Earth Obs. Geoinf. 2017, 62, 201–214.

Q&A conducted by Laura E.P. Rocchio, NASA Landsat Communication and Public Engagement team

Co-author Jingjing Li was partially supported by the NASA Minority University Research and Education Project (MUREP) Institutional Research Opportunity grant number [NNX15AQ06A].

On Key

Recent Posts

STELLA Photos

STELLA Spring Webinar: April 15, 2024

STELLA users will talk about their experiences using the DIY spectrometer during this webinar. Panelists include Bianca Cilento (RIT), Karen Karker (SUNY), and Peder Nelson (OSU and NASA GLOBE Observer).

Read More »
On Key

Related Posts