By Laura E.P. Rocchio
Dr. Chris Shuman, a glaciologist with Goddard and the University of Maryland at Baltimore County. Here is what Chris shared with us about the work he is presenting today at #AGU18:
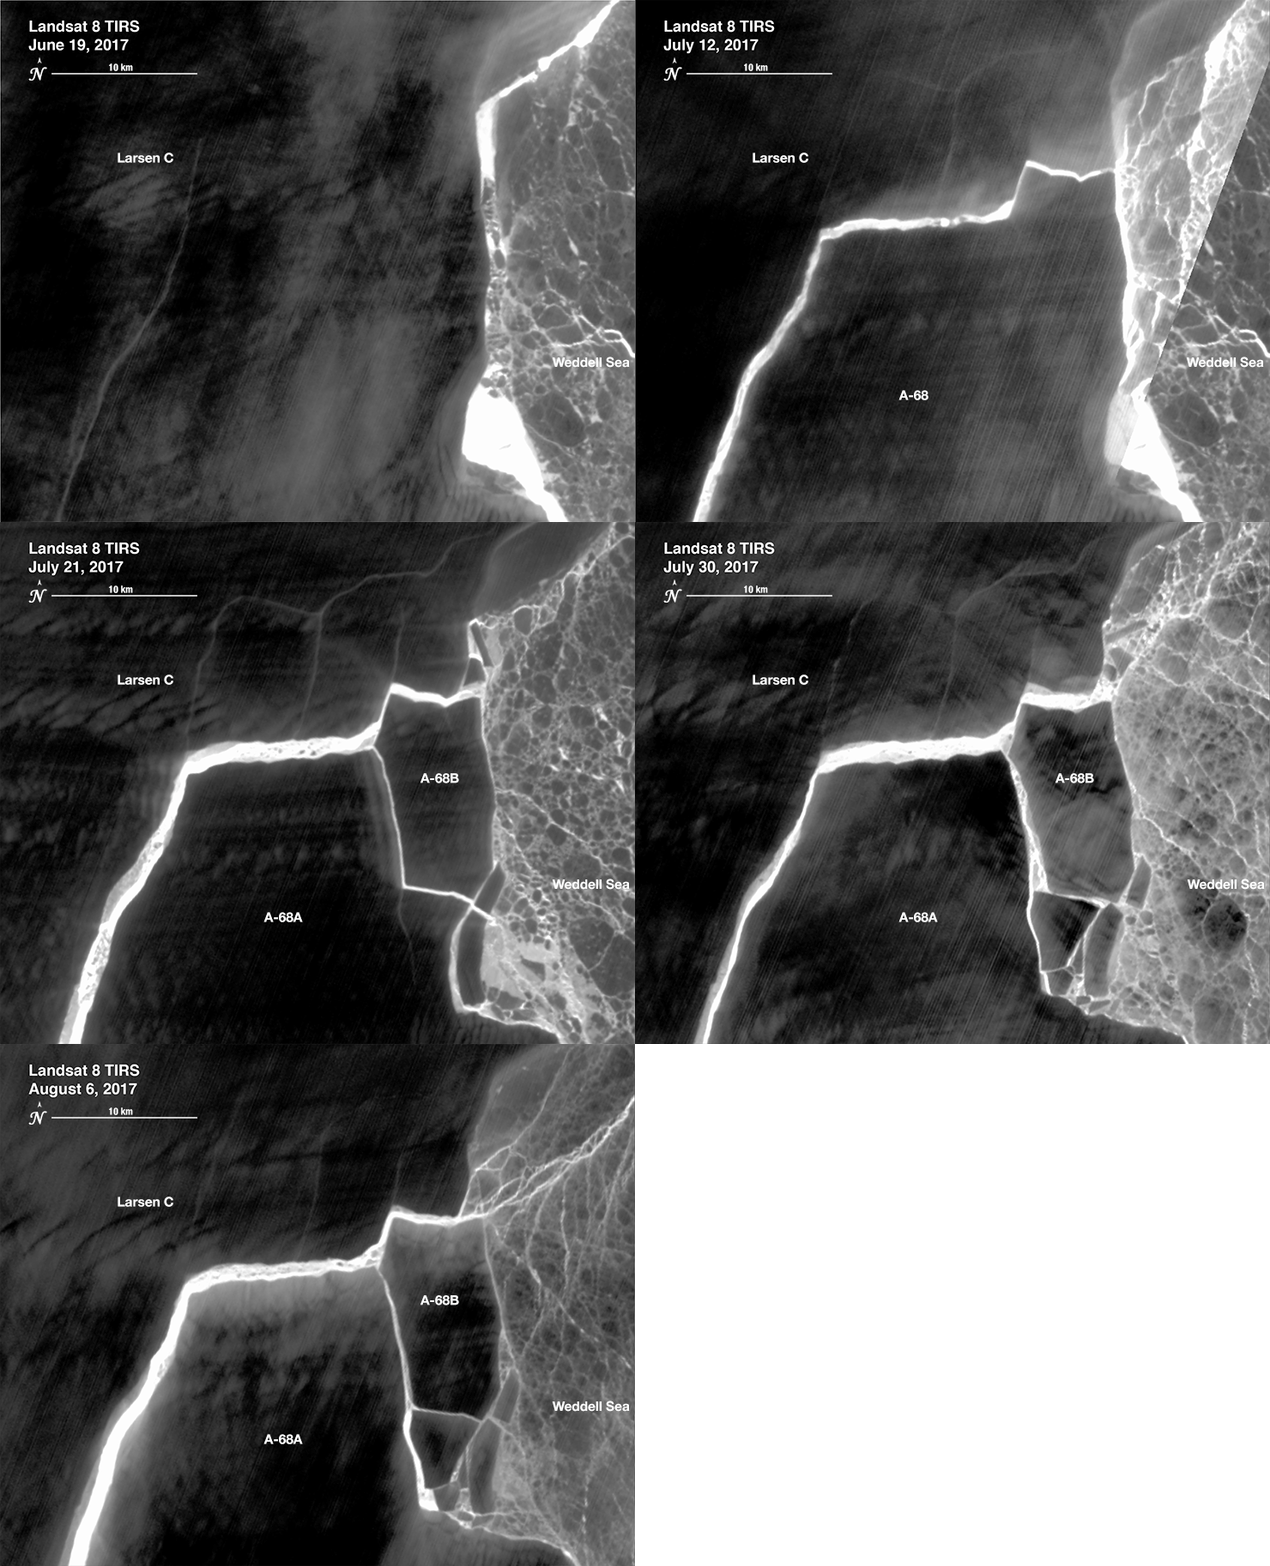
Thermal Imagery Tracks the Calving and Movement of Iceberg A-68 from the Larsen C Ice Shelf, 2017-2018
What are the major findings of this research?
The major findings are that Iceberg A-68 calved from the Larsen C during a period of larger then average tidal cycles and this was also almost a day earlier than was initially reported in July 2017 using MODIS imagery. Crucially, VIIRS IR imagery, although of lower resolution than similar TIRS IR data, made the initial calving quite clear with two passes on July 11th.
Further, Laurie Padman’s CATS2008 model data compared well with the available thermal imagery and helped to show that the initial ~5800 km2 iceberg made about six north, south voyages between July 11th and July 14th until a ~90 km2 iceberg (A-68B) broke off of the northeast end of the main berg (became A-68A).
What are the implications of your findings?
The implications of this study are that large iceberg calving events can be more dynamic than was generally considered. Velocity estimates, based on a series of thermal images from TIRS, VIIRS, and MODIS and supported by the CATS2008 tide model, indicate that the initial 1 trillion metric ton iceberg (Project MIDAS) was able to move at speeds greater than 300 meters per hour within the new embayment on the Larsen C’s front during the time frame of A-68B’s calving.
What insight did you gain from Landsat that would have been difficult to ascertain otherwise?
Landsat data enabled some details of the calving of both the initial iceberg and the secondary berg to characterized. Further, rifts that have not yet produced icebergs were also detailed as were features within the Larsen C that appear to have influenced the major calving event.
How do the Landsat 8’s TIRS and Suomi-NPP VIIRS instruments complement each other for this type of iceberg-tracking research?
The two types of thermal imagery each have their advantages, spatial detail from TIRS and more than one observation per day for the lower resolution VIIRS. When they are combined, they allow a greater understanding of calving events that may occur in a polar winter’s total darkness.

Co-authors:
Jeffrey E Schmaltz
NASA Goddard Space Flight Center
Ted A Scambos
National Snow and Ice Data Center
Anyone can freely download Landsat data from the USGS EarthExploreror LandsatLook.
Further Reading:
+ Landsat at #AGU18


