By Laura E.P. Rocchio
Today at #AGU16, Dr. Matthew Fagan, an assistant professor for the Department of Geography and Environmental Systems at the University of Maryland, Baltimore County, gave a talk on his recent research on forest edge effect in the southeastern U.S.
Here is what he shared with us:
Presentation Title
Beyond edge effects: landscape controls on forest structure in the southeastern U.S.
What are the major findings of this research?
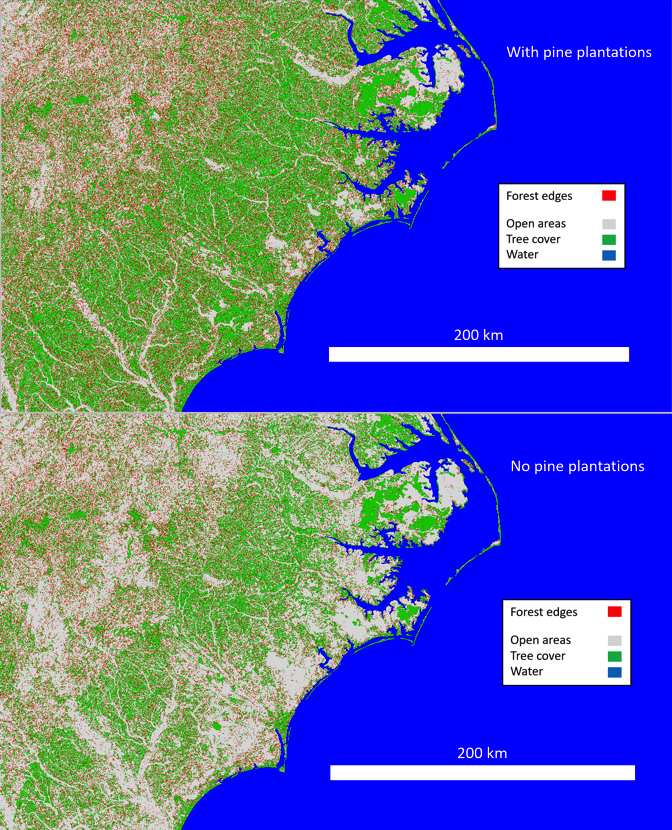
Plantations of pine trees make up about a third of the forest area in the southeastern U.S. Although remaining natural forests appear to be largely surrounded by forest cover (Figure 1), they are broken up by pine plantations and other human land-uses into small fragments of forest.
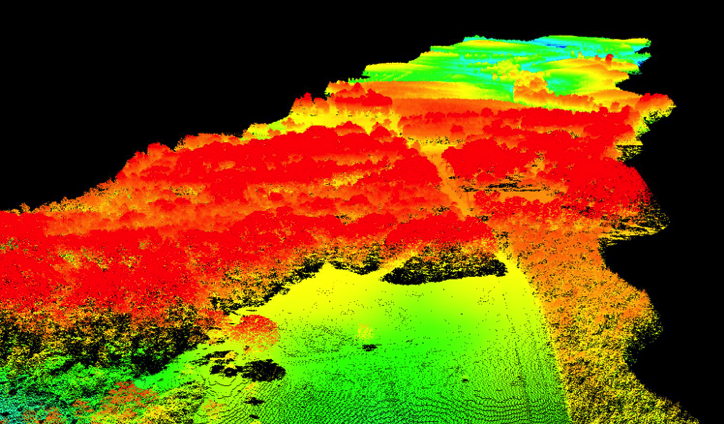
We investigated whether fragments of natural forest and pine plantations tend to be more disturbed, and shorter, than forests distant from a forest edge. Greater numbers of treefalls from wind have been observed near edges in many forests. Three-dimensional LiDAR measurements were gathered by the NASA G-LiHT aerial mission in 2011 (Figure 2). These LiDAR measurements let us estimate forest height and canopy openness (forest “ canopy structure”) over thousands of kilometers across the southeastern U.S.
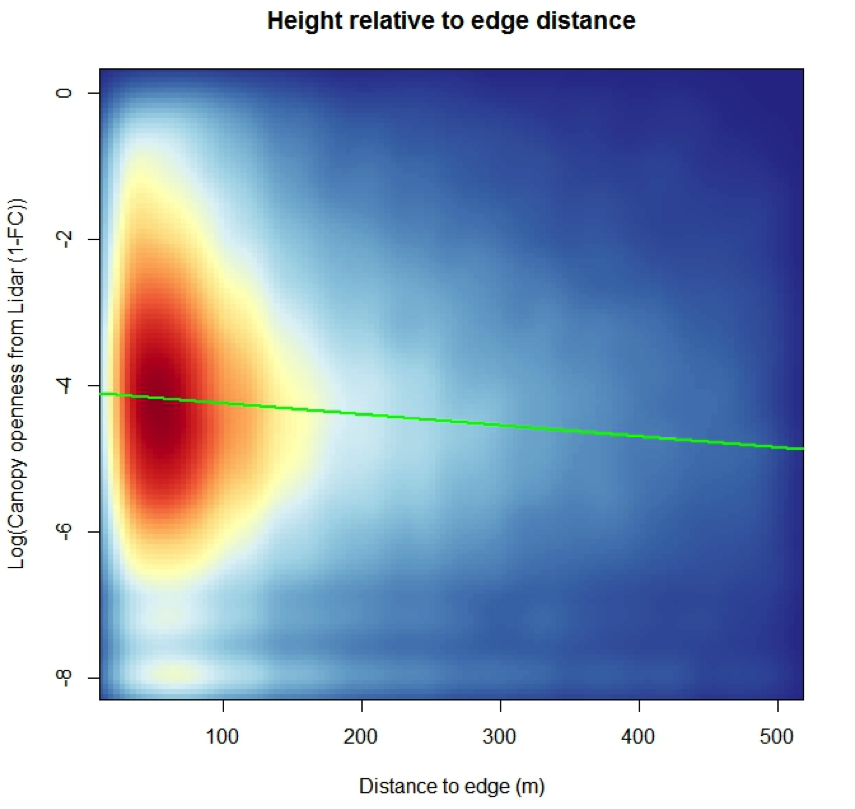
Contrary to what we expected from the scientific literature, we found relatively weak effects of moving away from an edge on the height of natural forests. However canopy openness was higher at forest edges, especially in older forests, implying that windthrow of tall trees is indeed more common at edges (Figure 3).
The roughness and elevation of the terrain also affected canopy height and structure; forests were more open at higher elevations, for example. But forest age was the dominant influence on the canopy structure of both pine plantations and natural forests; edge effects were relatively minor by comparison, and quite variable over the region.
What are the implications of your findings?
If this study is supported by additional field and remote sensing analyses, then we certainly don’t understand forest edges as well as we thought we did. They are strikingly variable from place to place, and until we understand why they vary, we will not be able to anticipate the carbon and habitat lost to windthrows each year.
Furthermore, this study implies that planting trees around forests (as the timber industry does) might protect forests from edge effects. We are investigating that right now; preliminary results offer some support for this hypothesis, but it may be a very small benefit.
What insight did you gain from Landsat that would have been impossible to glean otherwise?
It would have been impossible to do this study without the free data provided by Landsat. We used Landsat imagery to create our regional map of natural forests and pine plantations. In addition, our collaborator Dr. Chengquan Huang used Landsat to create a time series of forest ages across the U.S. In effect, Landsat allowed us to study the forest ecology of an entire region vital to our economy. The forestry industry in the southeastern U.S. has planted the largest industrial forest in the world.
Do forest managers often use Landsat and lidar in combination?
LiDAR is in wide use among forest managers to inventory their forest timber—you can often more accurately map a tree’s height from the air than from the ground. Landsat is also in wide use among forest managers for planning, usually in the form of maps derived from Landsat imagery like the NLCD (National Land Cover Database) or the MTBS (Monitoring Trends in Burn Severity). Combining LiDAR and Landsat is a natural fit for forest managers. Although LiDAR tells you a lot about the small area where you flew the plane, Landsat allows you to scale that small area measurement (of say, standing timber volume) up to a regional prediction, and monitor it over time for free.
Co-authors:
Douglas C Morton
NASA Goddard Space Flight Center
Bruce Cook
NASA Goddard Space Flight Center
Jeffrey G Masek
NASA Goddard Space Flight Center
Feng Aron Zhao
University of Maryland College Park
Ross Nelson
NASA Goddard Space Flight Center
Chengquan Huang
University of Maryland
This research was made possible by the NASA Postdoctoral Program Fellowship.
Anyone can freely download Landsat data from the USGS EarthExplorer or LandsatLook.
Further Reading:
+ Landsat Abounds at #AGU16