
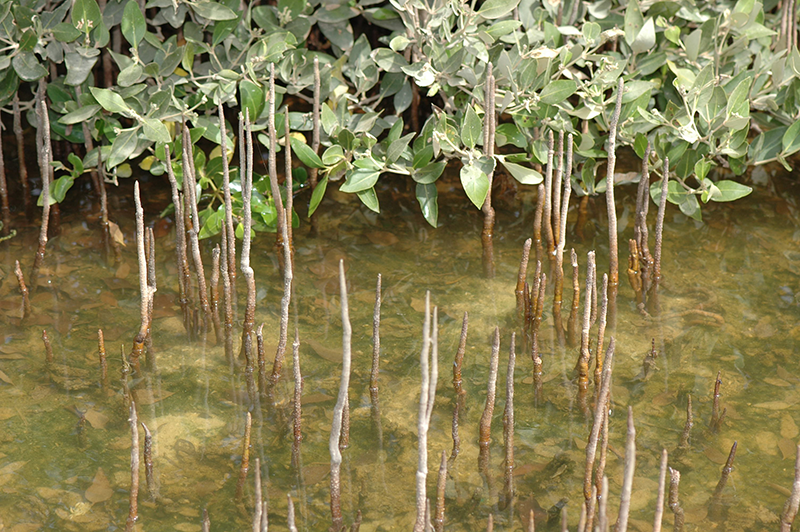
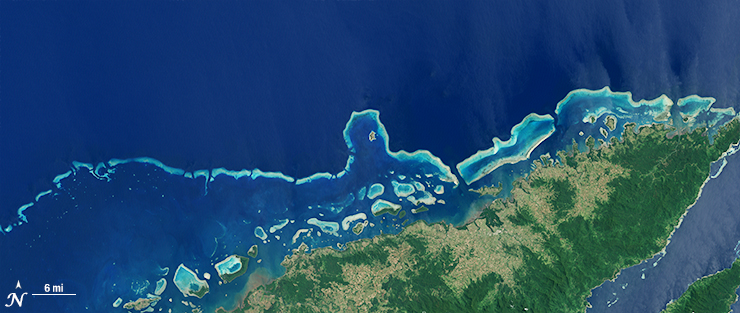
The Curious Case of Missing Mangroves in the Jubail Conservation
A group of researchers have used Landsat data to help solve a case of missing mangroves in Saudi Arabia’s Jubail Conservation.
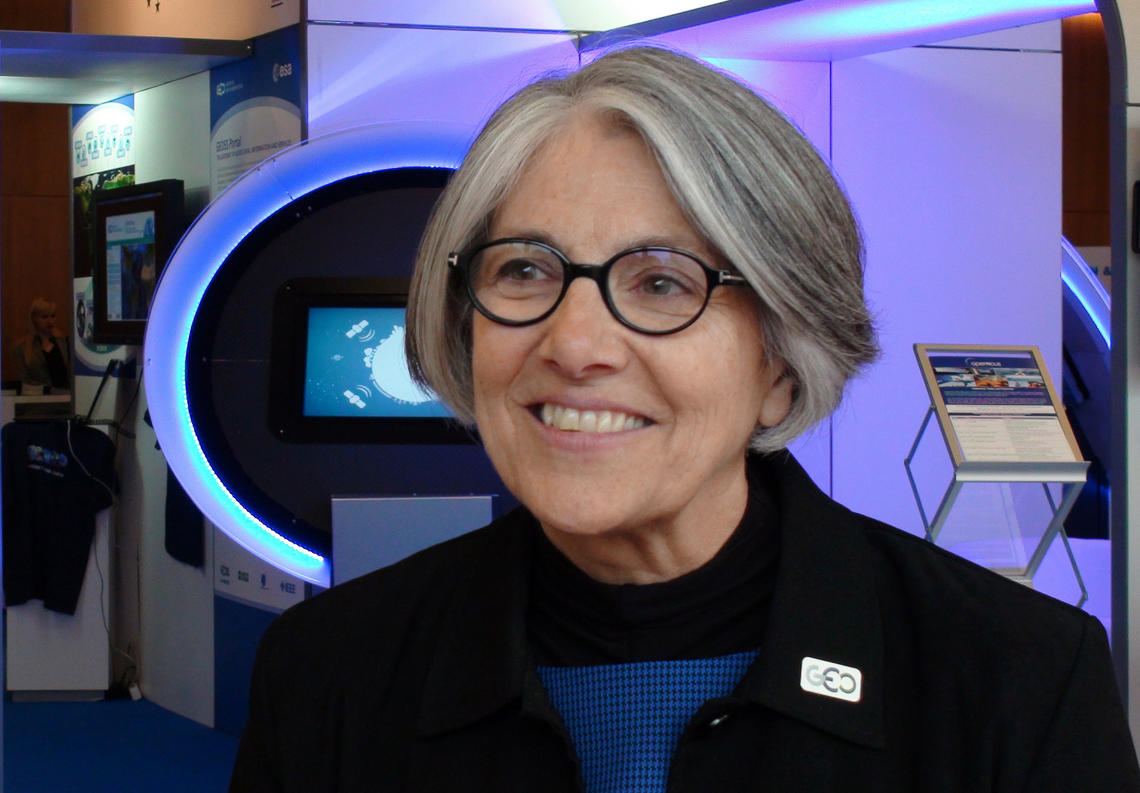
Barbara Ryan Wins 2018 Pecora Award
Barb Ryan was recognized with the individual Pecora award for her outstanding contributions as a scientist and visionary leader for advancing the global use of remote sensing through championing data democratization.
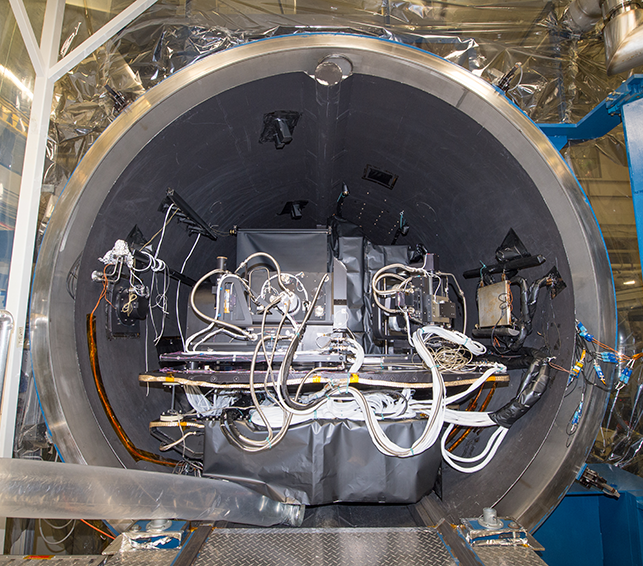
TIRS-2 Completes Baseline Thermal Vac Test
The completion of this test represents a major milestone for the TIRS-2 project, demonstrating that the team has built a well working instrument to meet the requirements of Landsat 9.
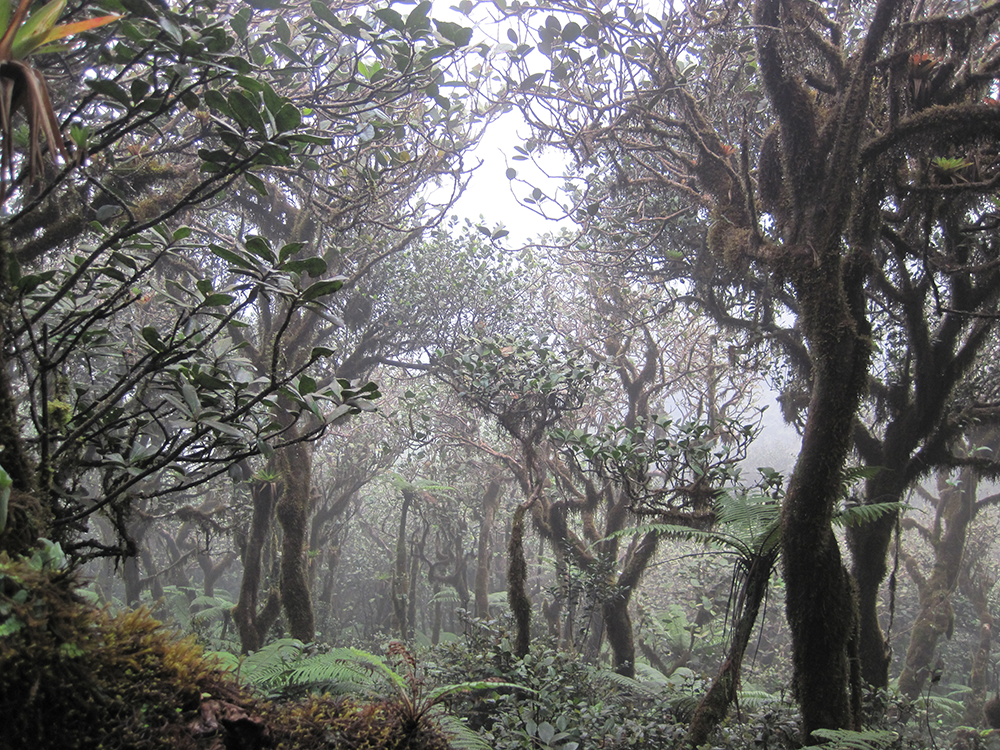
Neotropical Cloud Forests to Lose What Most Defines Them: Clouds
If greenhouse gas emissions continue increasing as they have been, 90% of Western Hemisphere cloud forests would be affected as early as 2060.
Twenty Years with Landsat 7
In the long and winding history of the Landsat Program, April 15, 1999 was an important day.
Landsat Level-3 Products Provide Land Cover Gold in Data Mining
Remote sensing scientists now can access a decades-long Landsat look at how specific conditions have played out on every applicable 30-meter pixel of the American landscape.
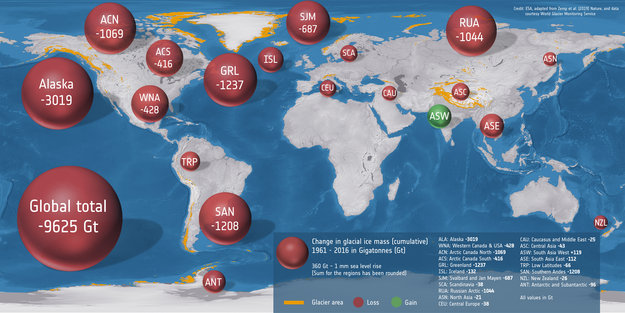
Glaciers Lose 9 Trillion Tons of Ice in Half a Century
An international team used classical glaciological field observations combined with a wealth of information from various satellite missions to painstakingly calculate how much ice has been lost or gained by 19 different glacierized regions around the world.
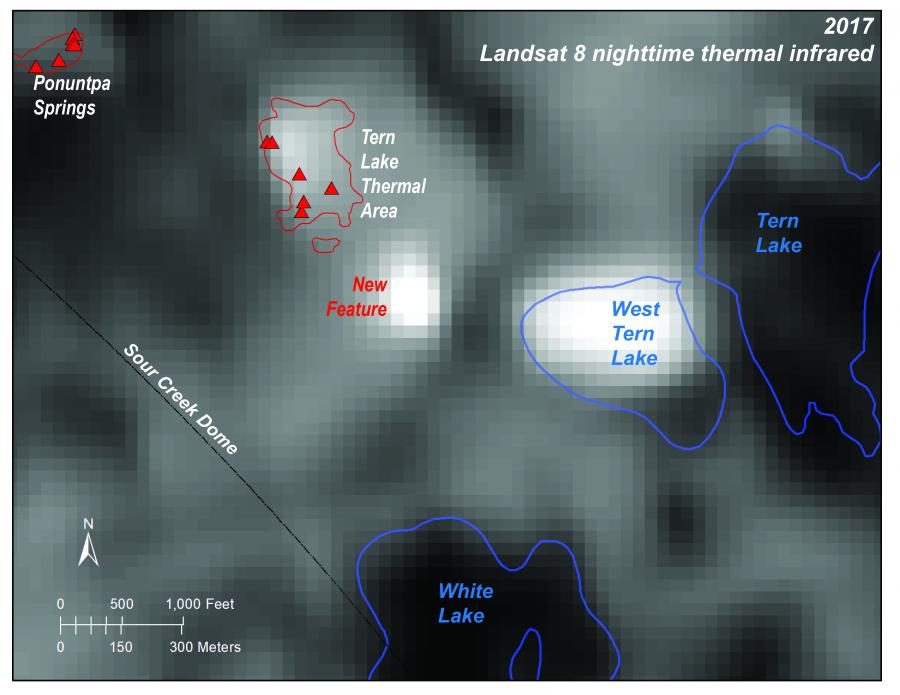
Discovering New Thermal Areas in Yellowstone’s Dynamic Landscape
Over the last 20 years, a new thermal area has developed in Yellowstone. Landsat 8 is on the case.
Landsat Level-3 Products Provide Land Cover Gold in Data Mining
Remote sensing scientists now can access a decades-long Landsat look at how specific conditions have played out on every applicable 30-meter pixel of the American landscape.
Glaciers Lose 9 Trillion Tons of Ice in Half a Century
An international team used classical glaciological field observations combined with a wealth of information from various satellite missions to painstakingly calculate how much ice has been lost or gained by 19 different glacierized regions around the world.
Discovering New Thermal Areas in Yellowstone’s Dynamic Landscape
Over the last 20 years, a new thermal area has developed in Yellowstone. Landsat 8 is on the case.
How Looking for Clouds Helped Forecast Global Food Production
It started as an algorithm to detect clouds in satellite imagery, but now the software is being used for everything from increasing food security in the developing world to guiding futures trading on Wall Street.
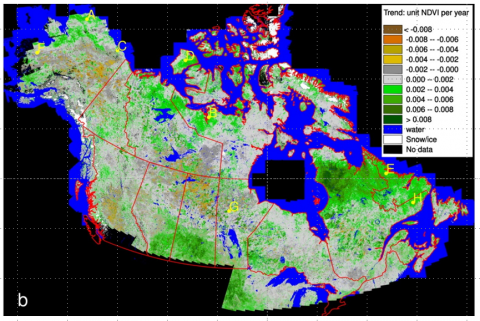
New Data Release: Summertime Greenness Trends for Alaska and Canada
The Arctic-Boreal Vulnerability Experiment (ABoVE) field campaign has released data of the summer NDVI trend and trend significance for 1984 to 2012 over Alaska and Canada.
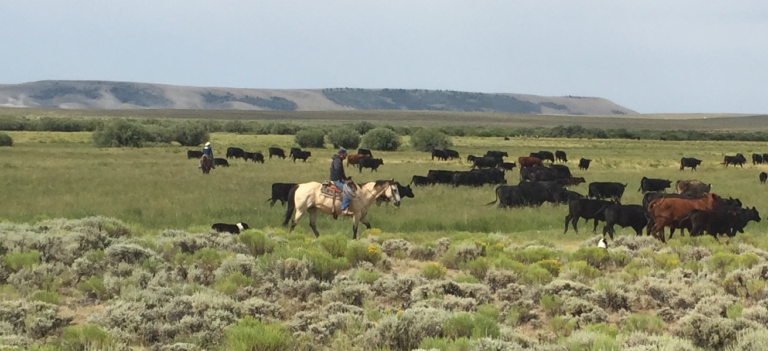
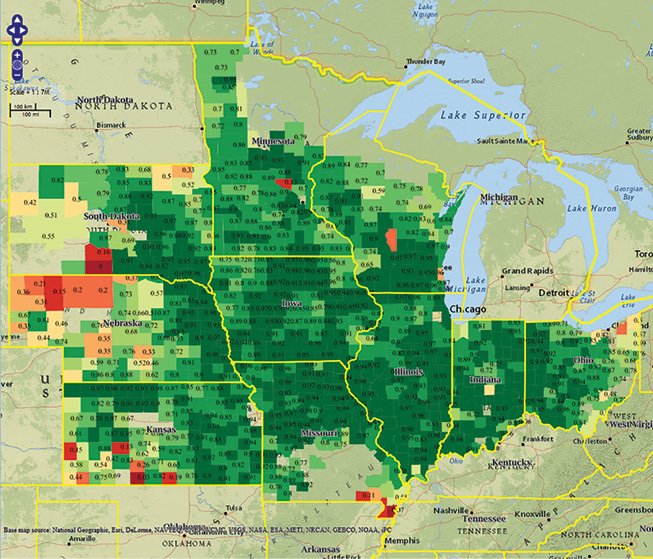
New Technologies for Range and Pasture Management
The Landsat-based Rangeland Analysis Platform and Green-Cast are valuable tools for ranchers adaptively managing their land.
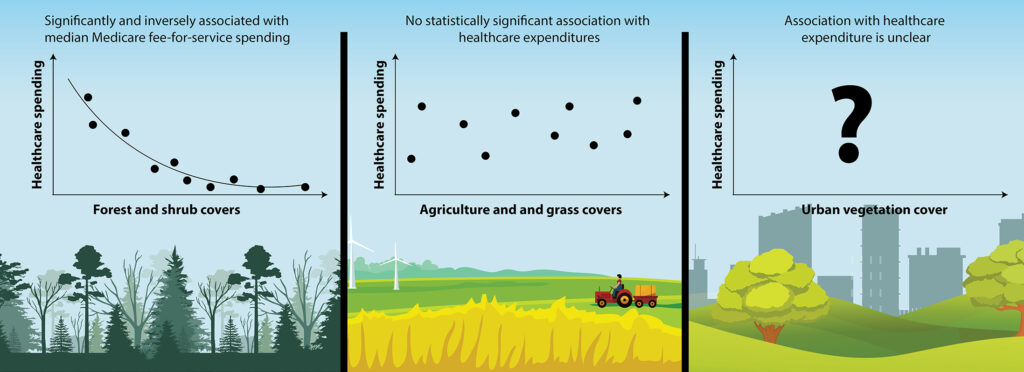
Green Space & Health: U.S. Counties with More Trees and Shrubs Spend Less on Healthcare
Each 1 percent of a county’s land that was covered in forest was associated with an average Medicare expenditure savings of $4.32 per person per year.
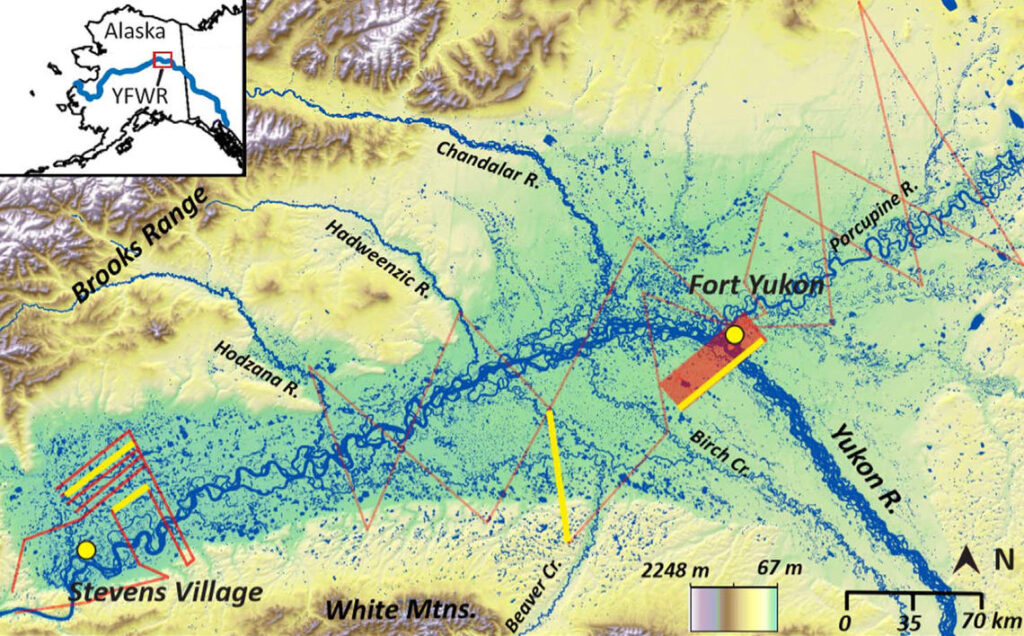
Landsat, Permafrost Data Offer Insight into Arctic Lake Dynamics
Remarkably little is known about the subsurface connections between the thousands of lakes scattered across ecoregions like Yukon Flats; this study sheds light on those lakes.
Huckleberry Bears: New Landsat-Aided Tool Maps a Key Food Source for Grizzlies
A Landsat-based approach to map huckleberry distribution across Glacier National Park could one day provide warnings of potential human-bear conflict areas.
Landsat Level-3 Products Provide Land Cover Gold in Data Mining
Remote sensing scientists now can access a decades-long Landsat look at how specific conditions have played out on every applicable 30-meter pixel of the American landscape.
Glaciers Lose 9 Trillion Tons of Ice in Half a Century
An international team used classical glaciological field observations combined with a wealth of information from various satellite missions to painstakingly calculate how much ice has been lost or gained by 19 different glacierized regions around the world.
Discovering New Thermal Areas in Yellowstone’s Dynamic Landscape
Over the last 20 years, a new thermal area has developed in Yellowstone. Landsat 8 is on the case.
How Looking for Clouds Helped Forecast Global Food Production
It started as an algorithm to detect clouds in satellite imagery, but now the software is being used for everything from increasing food security in the developing world to guiding futures trading on Wall Street.
New Data Release: Summertime Greenness Trends for Alaska and Canada
The Arctic-Boreal Vulnerability Experiment (ABoVE) field campaign has released data of the summer NDVI trend and trend significance for 1984 to 2012 over Alaska and Canada.
New Technologies for Range and Pasture Management
The Landsat-based Rangeland Analysis Platform and Green-Cast are valuable tools for ranchers adaptively managing their land.
Green Space & Health: U.S. Counties with More Trees and Shrubs Spend Less on Healthcare
Each 1 percent of a county’s land that was covered in forest was associated with an average Medicare expenditure savings of $4.32 per person per year.
Landsat, Permafrost Data Offer Insight into Arctic Lake Dynamics
Remarkably little is known about the subsurface connections between the thousands of lakes scattered across ecoregions like Yukon Flats; this study sheds light on those lakes.
Huckleberry Bears: New Landsat-Aided Tool Maps a Key Food Source for Grizzlies
A Landsat-based approach to map huckleberry distribution across Glacier National Park could one day provide warnings of potential human-bear conflict areas.
