Dr. Yuyu Zhou is a physical geographer and assistant professor at Iowa State University, today he presented his work on urban vegetation phenology trends at #AGU18, here is what he shared with us about his work:
Understanding phenology response to urbanization using high resolution satellite observations
Abstract:
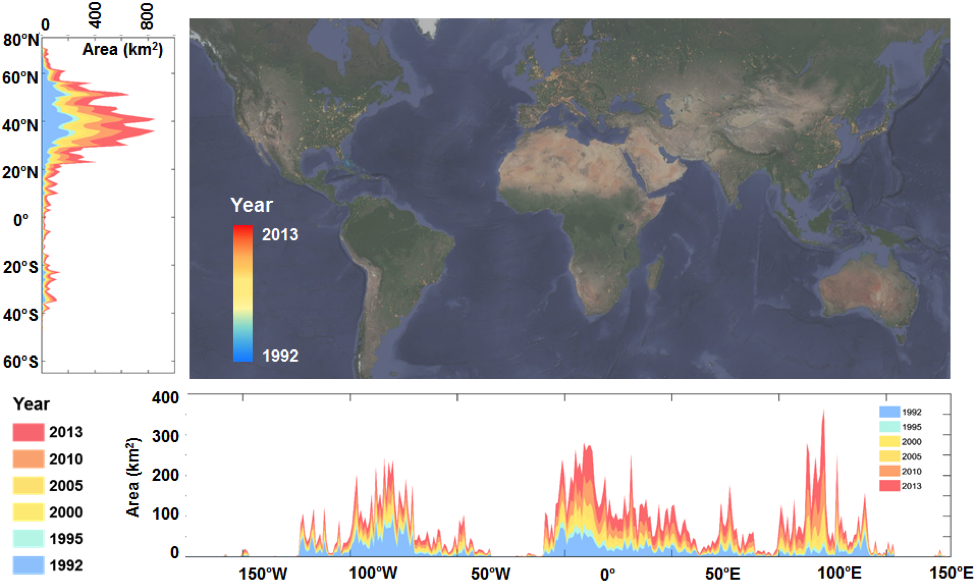
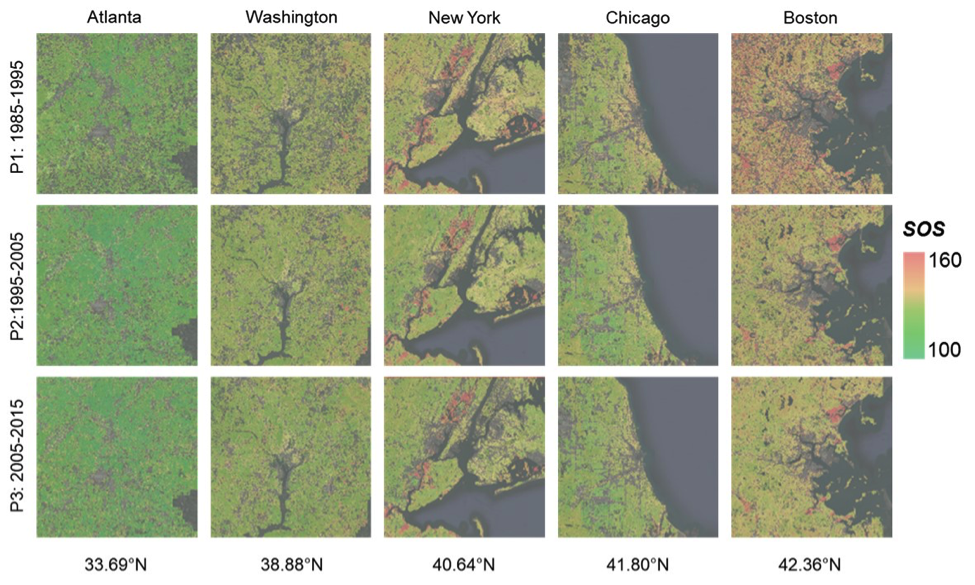
The influence of urbanization on vegetation phenology is gaining considerable attention due to its implications for human health, cycling of carbon and other nutrients in the Earth system. In this study, we developed a new algorithm to characterize vegetation phenology using high resolution satellite observations (Li et al. 2017). Using this algorithm, we mapped the dynamics of two key vegetation phenology indicators – (start of season (SOS) and end of season (EOS) – for urban and surrounding areas in the past three decades, for the conterminous U.S. We then examined the relationship between change in vegetation phenology and urban size, an indicator of urbanization, for more than 4500 urban clusters of varying sizes (Li et al. 2016). We found that the phenology cycle (changes in vegetation greenness/senescence) in urban areas starts earlier and ends later, resulting in a longer growing season length (GSL), when compared to the respective surrounding rural areas. Also, the extended GSL in urban areas is consistent among different climate zones, whereas their magnitude is varying across regions. We found a tenfold increase in urban size could result in an earlier SOS of about 1.3 days and a later EOS of 2.4 days. Finally, we investigated the underlying mechanistic processes of phenology response to urbanization by using four process based phenology models. The findings from this study is of great importance for developing improved models of vegetation phenology under future urbanization, and for developing change indicators to assess the impact of urbanization on vegetation phenology as related to human health.

What are the major findings of this research?
Interannual variability of vegetation phenology in urban and sub-urban systems can be derived from Landsat observations, despite complexities and high heterogeneity of land-cover types in these systems.
Landsat observations are suitable, due to high spatial resolution (30m) and multi-decades record length, to map vegetation phenology in urban and surrounding areas at the national and global level. The change in onset and duration of seasonal phenology in turn affects the duration and severity of pollen, which is a major risk for humans with respiratory allergies.
What are the implications of your findings?
The methodology and resulting phenology product from this study provide new insights on how vegetation phenology in urban and surrounding areas responds to urbanization environmental conditions.
The resulting phenology information also provides the possibility to evaluate the risk of respiratory allergies due to onset and duration of pollen season, especially in urban domains with a high population density.
What insight did you gain from Landsat that would have been difficult to ascertain otherwise?
Rapid growth of urban areas at the national, regional and global level affects the phenology of vegetation in these areas and surrounding rural areas. There are insufficient number and network of pollen monitoring stations in most urban and surrounding areas.
Remote sensing offers great potential to overcome this limitation. However, it is challenging to obtain such information from coarse resolution satellite observations, such as AVHRR and MODIS. Landsat has proved to be suitable for this purpose for its high spatial resolution (30m) and multi-decade record length.
Can you describe some of the impacts that urban vegetation phenology can have on human health?
Vegetation phenology indicator of “Start of Season” identified from Landsat observations is closely related to the start of the pollen season, thus, it can be used to assess pollen season severity and risk, and their impacts on respiratory allergies in urban domains.
Co-authors:
Xuecao Li
Iowa State University
Ghassem Asrar
Pacific Northwest National Laboratory
Lin Meng
Iowa State University
This research was made possible with funding from the NASA ROSES INCA Program (NNH14ZDA001N-INC).
Anyone can freely download Landsat data from the USGS EarthExplorer or LandsatLook.
Further Reading:
+ Landsat at #AGU18


