Dr. Bandana Kar is part of the research & development staff at Oak Ridge National Laboratory in Oak Ridge, Tennessee. Here is what Bandana shared with us about the work she presented this afternoon at #AGU19:
Integrating Earth Observation Data with Socio-Economic Data to Understand the Relationship Between Urban Heat Islands and Social Vulnerability
What are the major findings of this research?
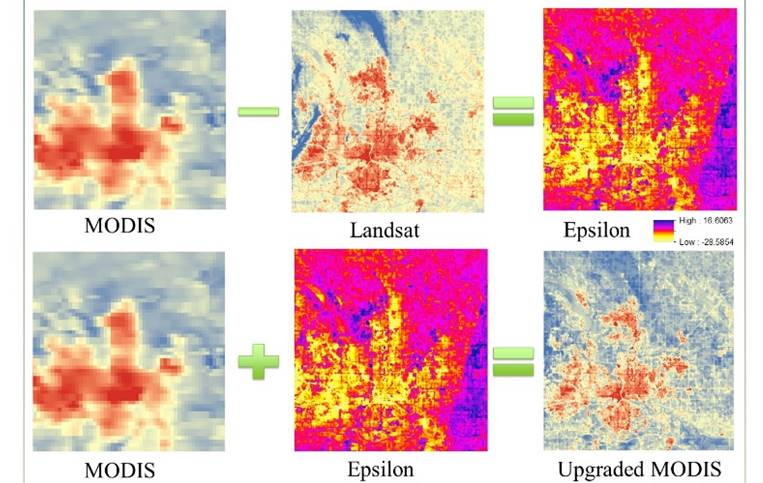
We have found that increasing land surface temperature is associated with decreasing vegetation (represented by the Normalized Vegetation Difference Index – NDVI), and both of these parameters are related with areas occupied by a higher percentage of vulnerable populations. Specifically, socio-economically vulnerable populations (young and elderly populations, population with lower income and education, unemployed and those living in older houses) are at a higher risk of experiencing urban heat effects.
What are the implications of your findings?
The results can be used by city officials to identify the locations of specific socio-economically vulnerable populations susceptible to experiencing urban heat effects. This information will help public health professionals and city officials identify mitigation strategies, such as adaptation of green infrastructures (parks and vegetation) to reduce health impacts of heat. The same green infrastructures can be used to reduce energy consumption in urban areas experiencing urban heat island effects.
What insight did you gain from NASA/USGS Landsat that would have been difficult to ascertain otherwise?
The parameters crucial to determining urban heat islands and their effects are: NDVI, land surface temperature (LST) and land use/cover change. Landsat data were valuable in extracting NDVI, LST surfaces for urban areas and land use/cover distribution.
Is there any actionable information from your work that urban planners and city managers will be able to use?
Two pieces of actionable information that the urban planners and city managers can use are:
(i) the major land use areas experiencing significant urban heat island effects and
(ii) the vulnerable populations and their spatial distribution in relation to urban heat islands.
These two pieces of information are valuable for identifying mitigation strategies (green infrastructure deployment and public health facility placement) to reduce the heat island effects not only on the vulnerable populations, but across a city. This information can also be used in identifying potential locations to place urban sensors to capture temperature and green house gas emissions that also contribute to urban heat for more granular exploration.
Co-author:
Tamar Moss
Brandeis University
This work was supported in part by the U.S. Department of Energy, Office of Science, Office of Workforce Development for Teachers and Scientists (WDTS) under the Science Undergraduate Laboratory Internship program.
Anyone can freely download Landsat data from the USGS EarthExplorer or the LandsatLook Viewer.
Further Reading:
+ Landsat at the 2019 AGU Fall Meeting
+ Hot in the City, And Hotter Still in Low-Income Areas