
“We have entered a new era where we’re definitely seeing higher fire activity,” said Philip Dennison, a geographer at the University of Utah in Salt Lake City.
With busy fire seasons, scientists and fire managers are interested in how and why fire frequency, severity and duration changes over time. To help investigate these trends, the U.S. Forest Service and U.S. Geological Survey are using Landsat data to quantify every large fire in the United States since 1984 and map each fire’s severity and effect on the land. The project, called the Monitoring Trends in Burn Severity project, or MTBS, provides long-term burn severity maps and data to help researchers understand fire trends in the United States.
The valuable burn severity data can inform fire management policies and improve the management of resources, said Brad Quayle, a program leader at the USDA Forest Service Remote Sensing Applications Center, or RSAC, in Salt Lake City. Researchers like Dennison also use the data to investigate how and why fire behavior changes over the years. But getting the big picture takes a lot of data over many years, which is why the 27-year MTBS data record relies on data from NASA and the U.S. Geological Survey’s Landsat program.
Landsat is the longest running Earth-observing satellite program. The data record goes back more than 40 years, collected by a series of satellites that observe land cover at comparable resolution and with the quality necessary for long-term research. Currently Landsat satellites 7 and 8 are in operation.
The MTBS project team creates fire maps from Landsat imagery by analyzing the vegetation in the burned area. The project is a collaboration between RSAC and the USGS Earth Resource Observation and Science Center, or EROS, located in Sioux Falls, S.D. So far, the two organizations have mapped over 16,000 fires from 1984 to 2011 and will soon process data from the recently launched and operational Landsat 8 for the MTBS project.
“It’s very important for us to maintain the continuity of having the spectral bands that have been there since day one, particularly the near infrared and short wave infrared bands,” said Quayle.
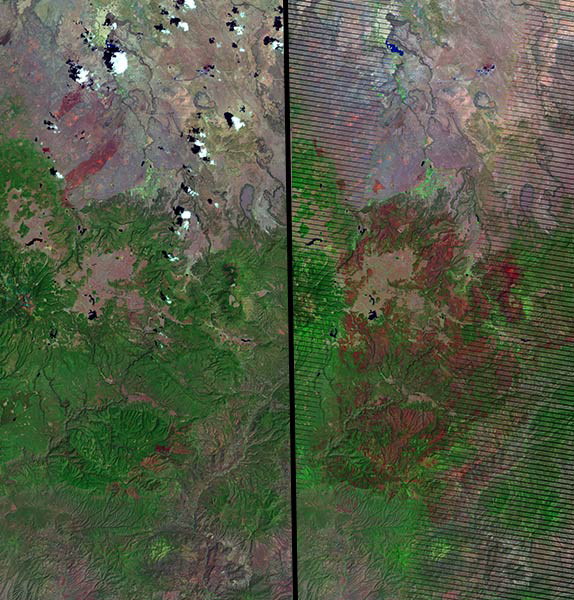
The sensors aboard the Landsat satellites measure different spectral wavelengths, or bands, of light reflected or emitted from Earth surface features. Many of the bands are outside of the range of wavelengths that humans can see, including the near infrared and shortwave infrared wavelengths. Data from these two wavelength regions are used to assess burn severity. Healthy green vegetation reflects near infrared light strongly. Bare ground and soil are dark in the near-infrared, and bare burned areas tend to be relatively bright in the short-wave infrared. Using the data from both bands, researchers can establish how badly a fire has affected a forest, shrubland or other types of wildland vegetation.
To create the burn severity maps, Quayle and his colleagues first look into various databases for fires larger than 1,000 acres in the western United States and 500 acres in the eastern US. Fires of these sizes typically account for the vast majority of the area burned on an annual basis. Next, they find a pre-fire Landsat image and a post-fire Landsat image for each fire. To get an accurate picture of how much vegetation was damaged by the fire, the post-fire image is usually acquired one year after the fire occurred and during the peak of growing season.
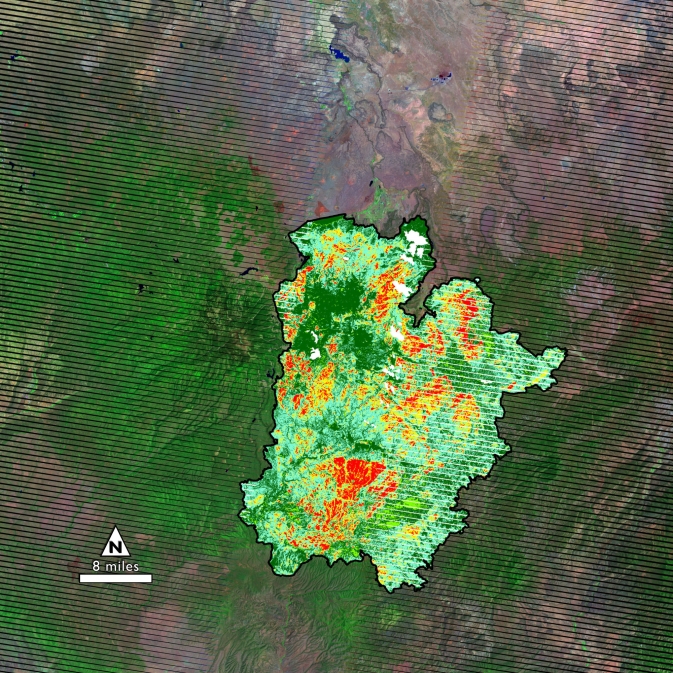
Looking at the near and short-wave infrared data on chosen Landsat images, MTBS analysts calculate the Normalized Burn Ratio for each image — a numerical measurement of how much vegetation remains. The Normalized Burn Ratio helps researchers make “apples-to-apples” comparisons of fire severity in the images. Analysts then subtract the post-fire normalized burn ratio from the pre-fire normalized burn ratio to assess the magnitude of change in vegetation. The calculation is similar to measuring a child’s height at age three and four and only recording the difference.
“The big advantage to MTBS is that it maps all large fires on all U.S. lands. It captures public lands and private lands,” said Dennison. “That’s really nice to have as a researcher because it makes your analysis much more comprehensive.”
Dennison and his team at the University of Utah regularly use the burn severity data to research overall trends of fires over the decades. He records the number of fires, total area burned each year, the size of the largest fires and when the earliest fires are occurring to see if the fire seasons are shifting earlier or later in the year.
He has analyzed over 6,000 fires using the MTBS data and has observed that fires larger than 1,000 acres are increasing by the rate of about six fires per year in the western United States. He is currently investigating possible causes of the increased fire activity.
The data also has more immediate uses by fire management teams. Eric Gdula is a fire geographic information system specialist for the National Park Service, working at Grand Canyon National Park in Arizona. The Park Service manages both lightning-caused fires as well as controlled fires ignited to improve ecosystem health. In certain areas, fire helps restart forest life by dispersing seeds and clearing out undergrowth so new trees can flourish. After a prescribed fire or a wildfire, Gdula uses the burn severity maps to evaluate the overall effects of the fire on the forest ecosystem and to estimate how much fuel or vegetation has burned.
Before burn severity maps from the MTBS project, fire calculations and observations were much harder to make. Researchers often gathered data from field or aerial surveys— literally someone looking out over a ridge or in a helicopter and marking areas on topographic maps. Gdula noted that some of his observations would be near impossible to make without the Landsat-derived burn severity maps in MTBS. With Landsat 8, MTBS data continuity will continue for at least the duration of operational Landsat satellites.
“The sheer extensiveness of the data set, having that calibrated data, reaching back in the past and also ensuring that we have the data source well into the future so we can continue this exercise, is an outstanding benefit to resource management provided by Landsat,” said Quayle.
Contributor: Kasha Patel, NASA’s Goddard Space Flight Center

Be Part of What’s Next: Emerging Applications of Landsat at AGU24
Anyone making innovative use of Landsat data to meet societal needs today and during coming decades is encouraged to submit and abstract for the upcoming “Emerging Science Applications of Landsat” session at AGU24.


