 Dr. Kyle Knipper is a postdoctoral research associate at the U.S. Department of Agriculture’s Agricultural Research Service (USDA ARS). Here is what Kyle shared with us about the work he is presenting today at #AGU18:
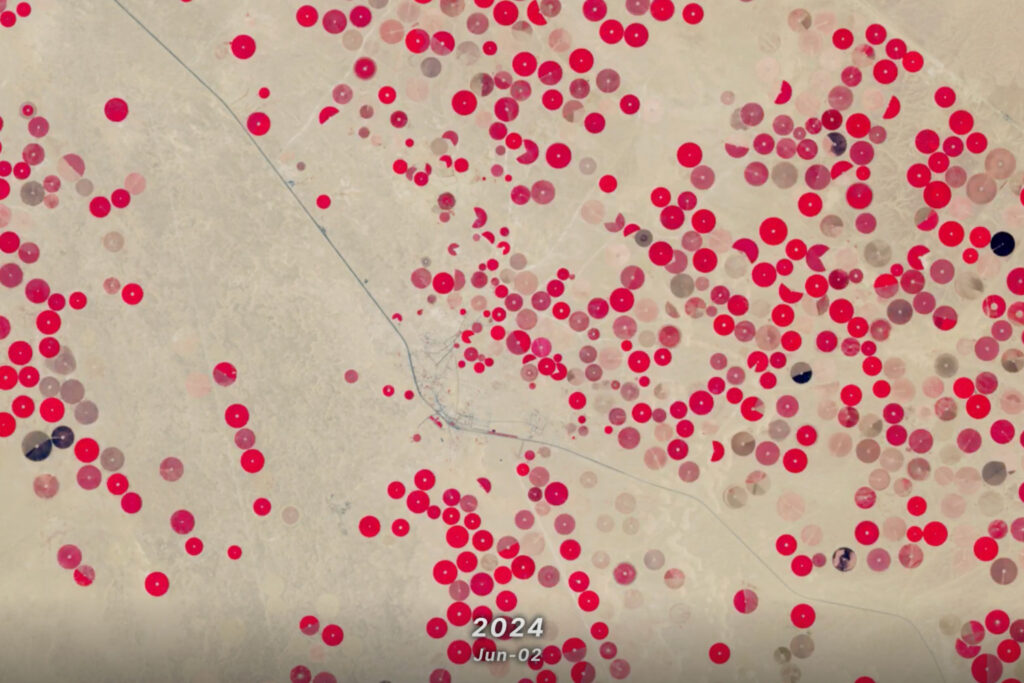
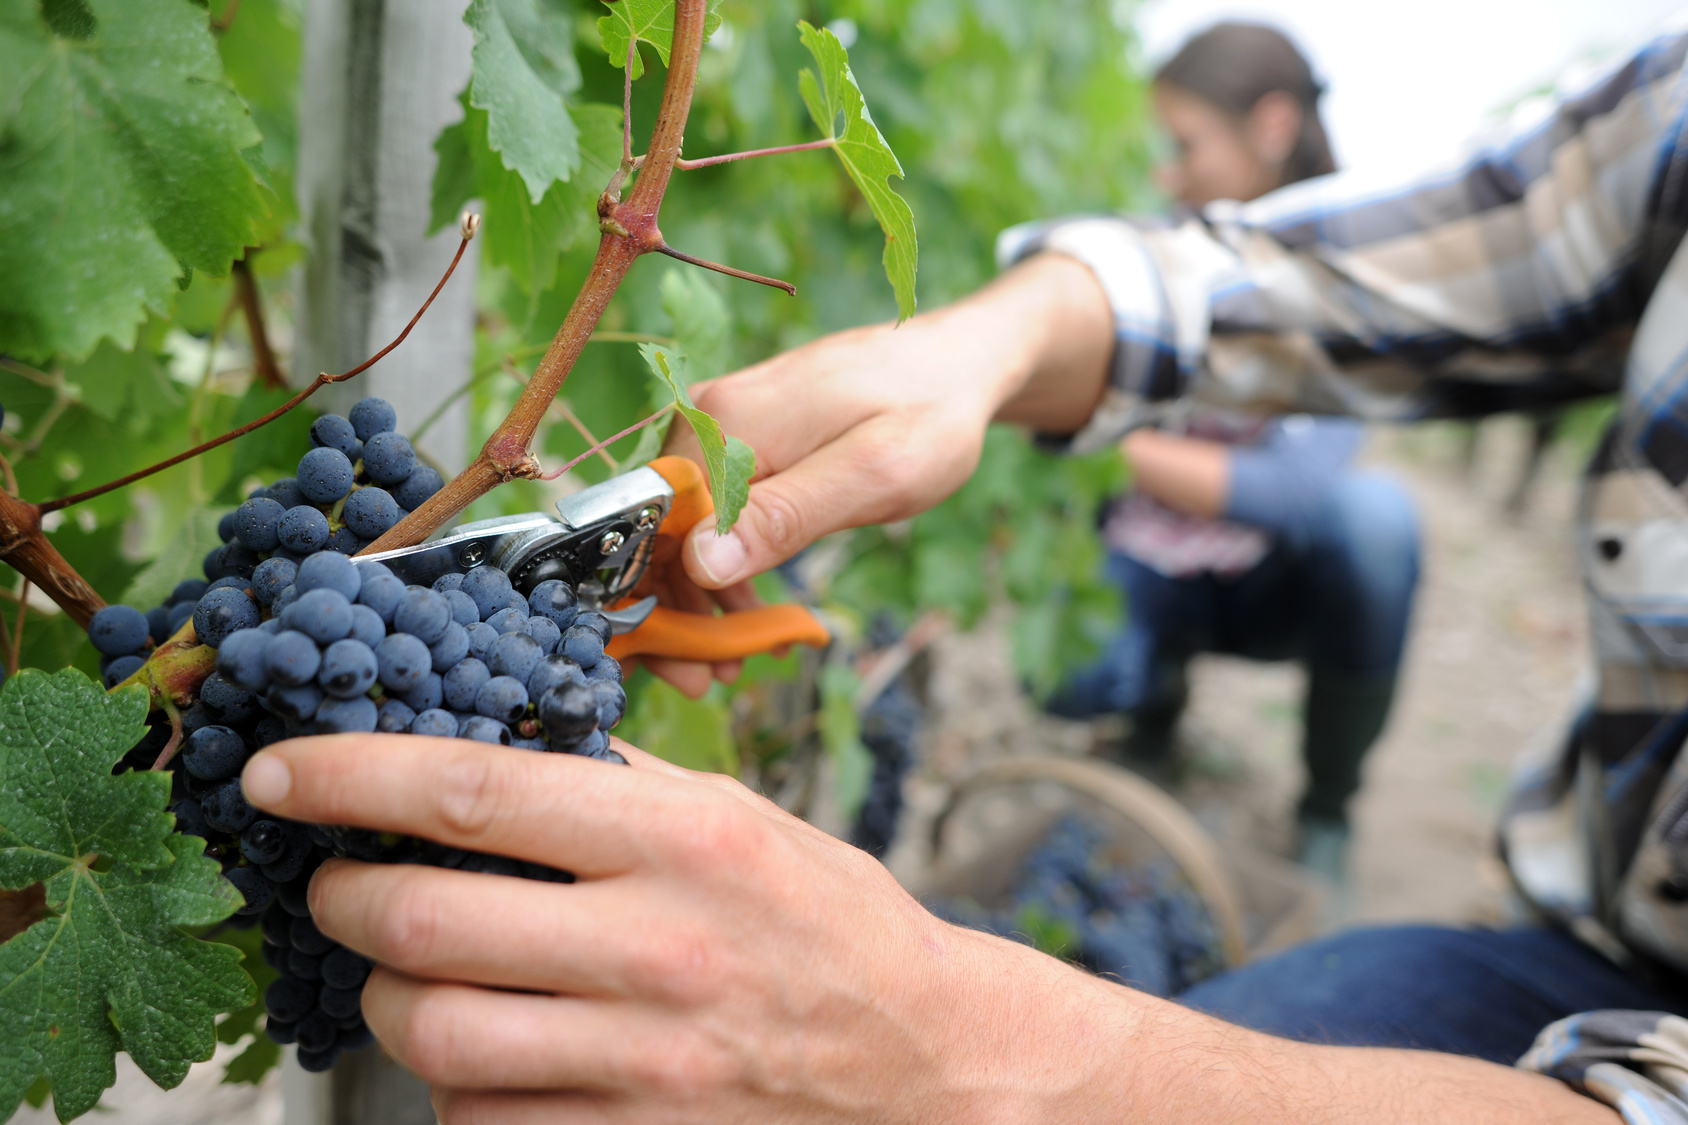
Monitoring Vineyard Water Use and Vine Stress Using Thermal-Based Satellite Remote Sensing for Improved and Sustainable Water Management
What are the major findings of this research?
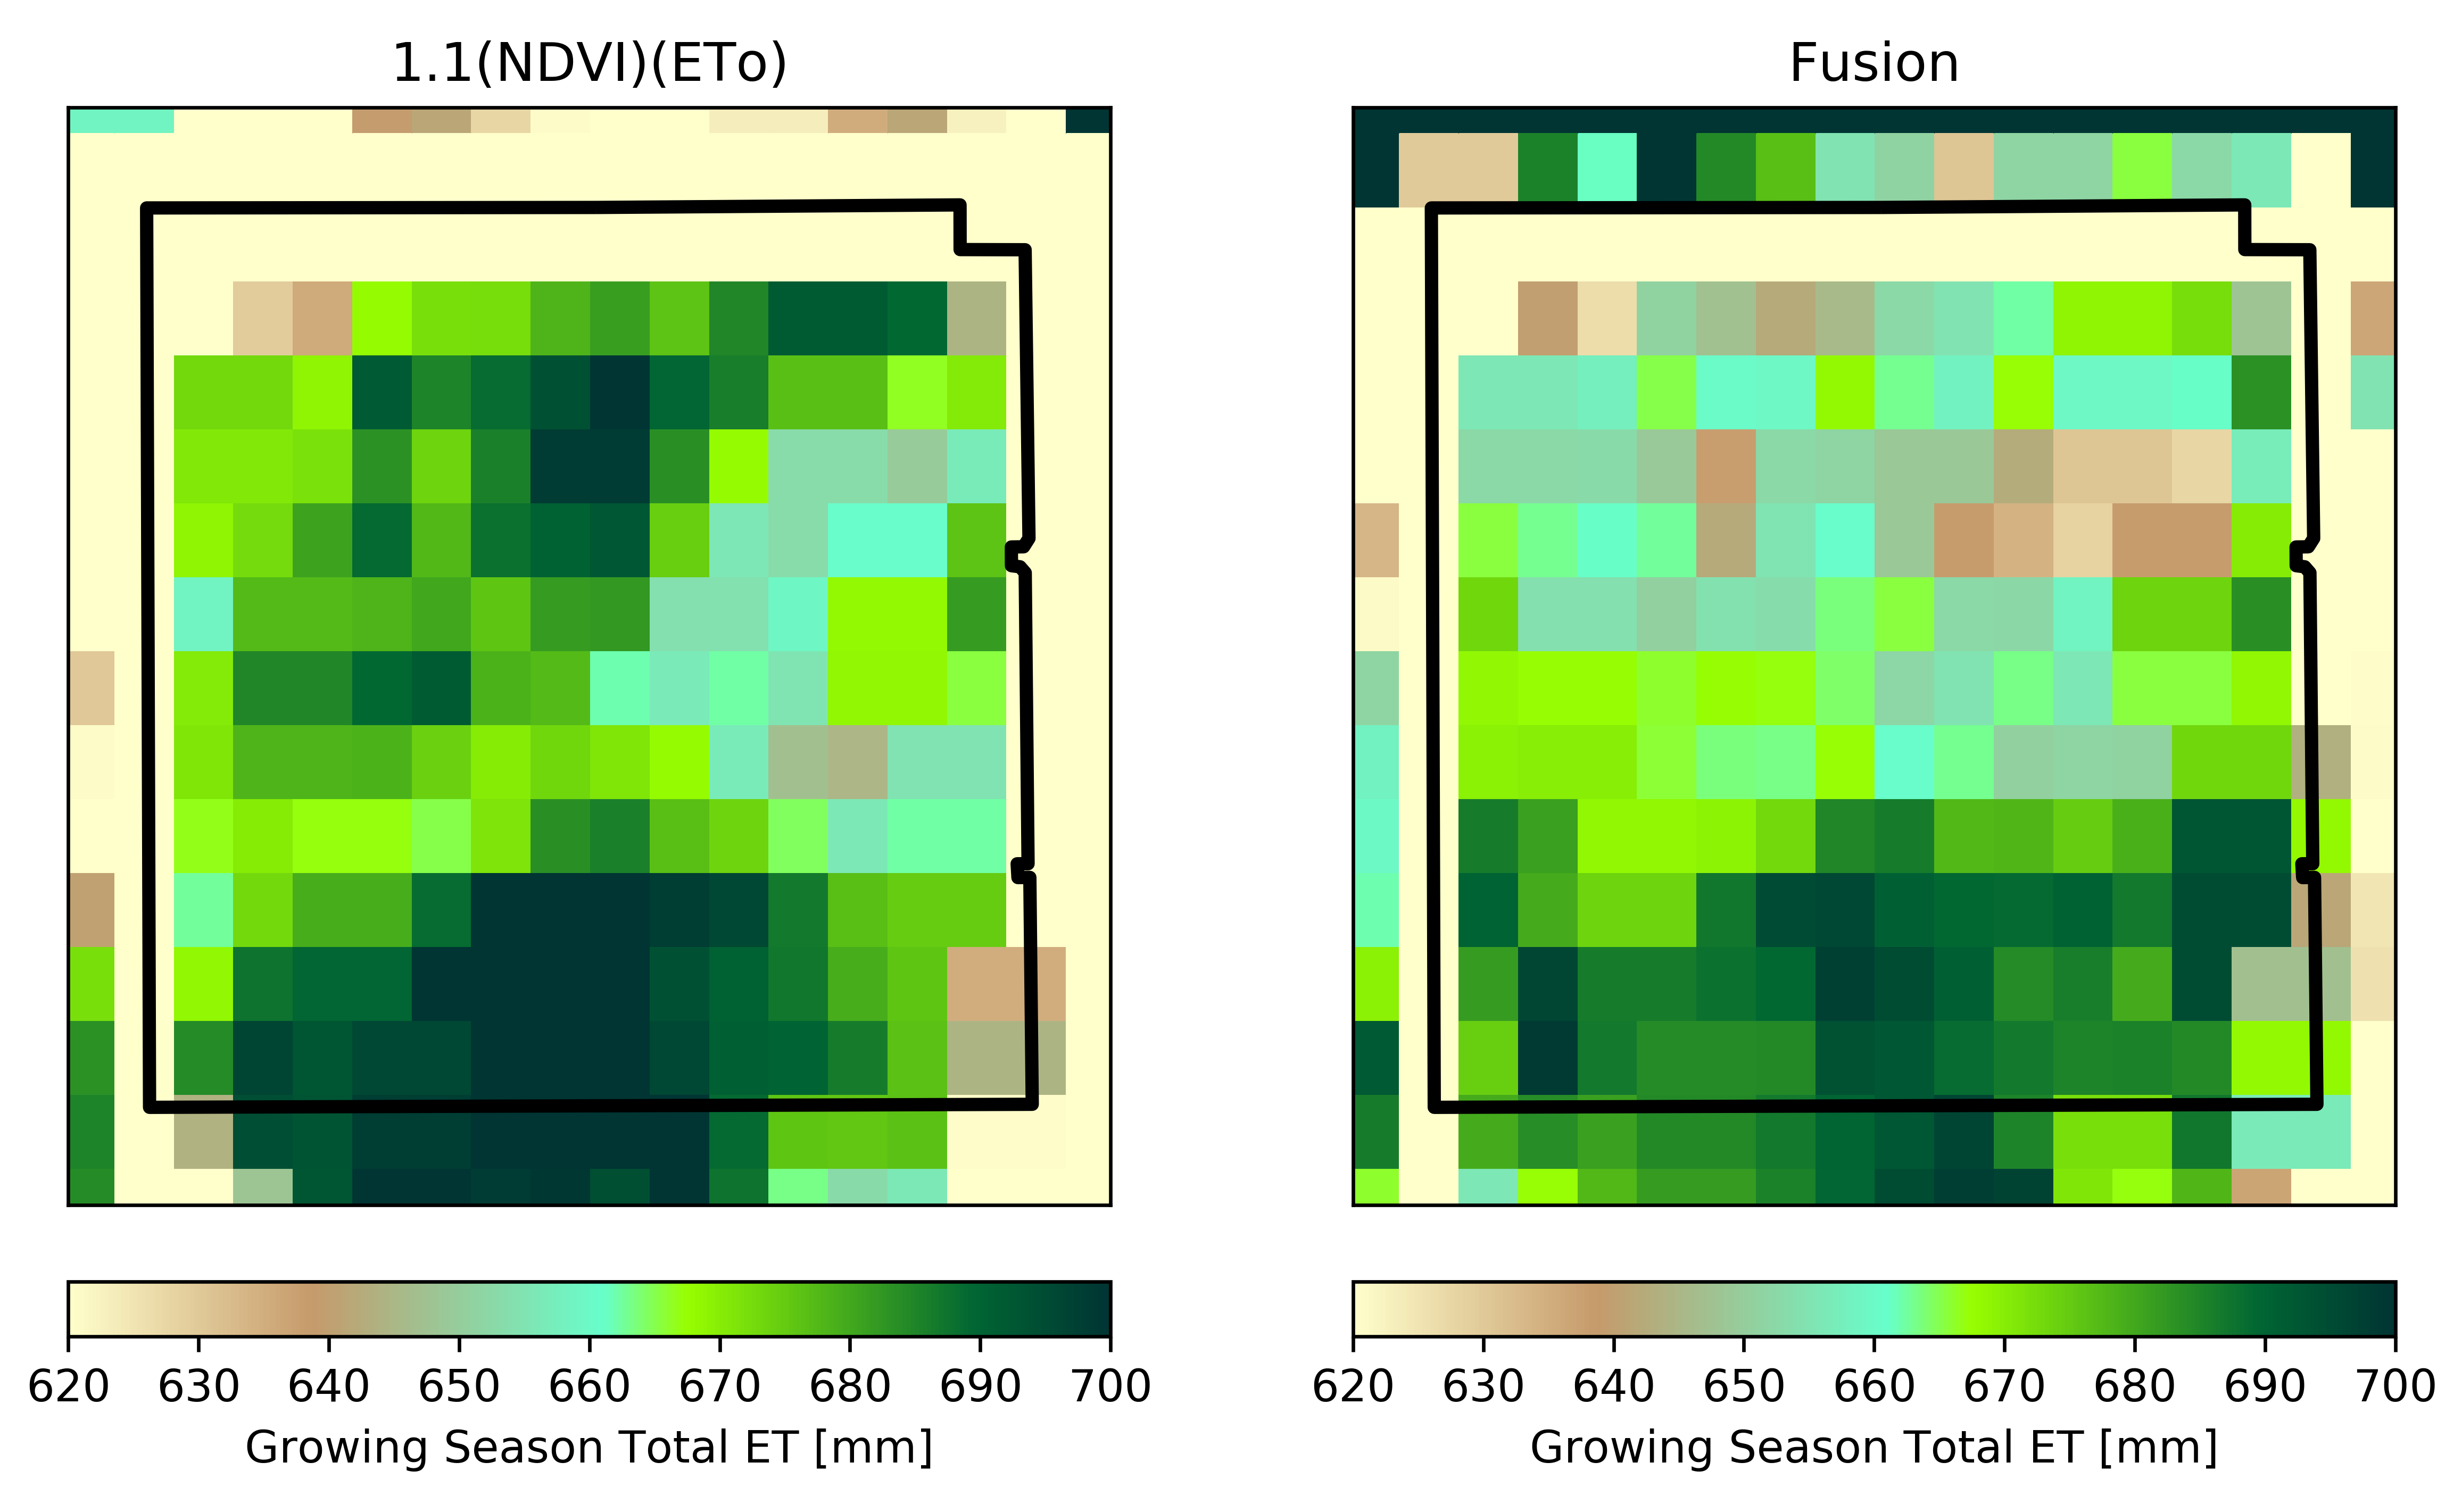
The utilization of thermal imagery, including that of Landsat thermal bands, allows us to provide quantifiable values of, and decipher spatial differences in, water use and moisture status at the field/management scale.
What are the implications of your findings?
Our research indicates that quantifying values of, and deciphering spatial differences in, water use and moisture status can be done in near real time, providing insight to growers and allowing them to make more informed decisions when it comes to irrigation management.
What insight did you gain from Landsat that would have been difficult to ascertain otherwise?
The Landsat thermal bands, at 100m spatial resolution, allow us to resolve water use and moisture status at the management scale. Passive microwave soil moisture retrieval techniques are too coarse to get down to that critical scale.
This year we saw a clear difference in the information provided by standard crop coefficient techniques for estimating evapotranspiration, or ET (a proxy of water use) using surface reflectance based vegetation indices and the surface energy balance methods that additionally consider thermal signatures of crop stress and soil moisture depletion. The thermal bands picked up stress during critical periods of crop development that were not reflected in the surface reflectance data.
More broadly, do you consider open data policies for medium-resolution remote sensing data an important element for operational water management tools?
Real time management relies on obtaining all usable information as quickly as possible, and when scaled up over total management area the free access policy makes these kinds of experiments tenable from a research perspective.
Co-authors:
William P Kustas
USDA ARS Hydrology and Remote Sensing Laboratory
Martha Anderson
USDA ARS Hydrology and Remote Sensing Laboratory
Joseph G Alfieri
U. S. Department of Agriculture, Agricultural Research Service, Hydrology and Remote Sensing Laboratory
John H Prueger
U. S. Department of Agriculture, Agricultural Research Service, Hydrology and Remote Sensing Laboratory
Christopher Hain
National Integrated Drought Information System
Feng Gao
USDA-Agricultural Research Service Beltsville
Anyone can freely download Landsat data from the USGS EarthExplorer or LandsatLook.
Further Reading:
+ Landsat at #AGU18