By: Steven Young, USGS
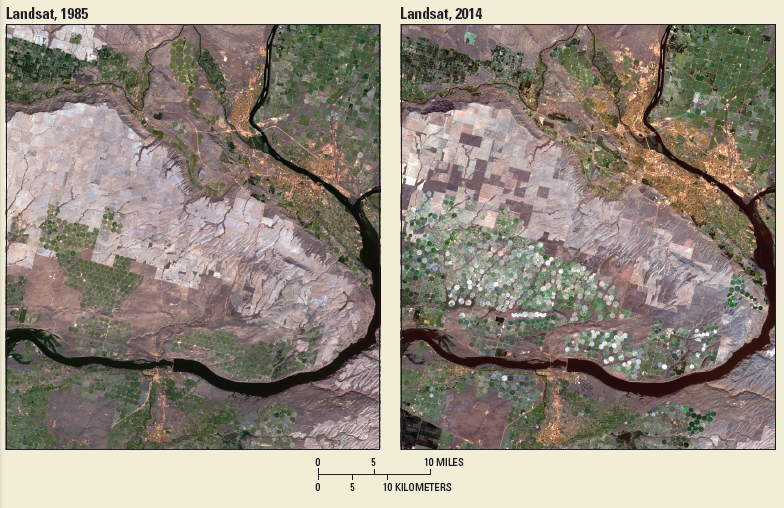
When nature and humanity change Earth’s landscapes— through flood or fire, public policy, natural resources management, or economic development—the results are often dramatic and lasting.
Wildfires can reshape ecosystems. Hurricanes with names like Sandy or Katrina will howl for days while altering the landscape for years. One growing season in the evolution of drought-resistant genetics can transform semiarid landscapes into farm fields.
In the past, valuable land cover maps created for understanding the effects of those events—whether changes in wildlife habitat, water-quality impacts, or the role land use and land cover play in affecting weather and climate—came out at best every 5 to 7 years. Those high quality, high resolution maps were good, but users always craved more: even higher quality data, additional land cover and land change variables, more detailed legends, and most importantly, more frequent land change information.
Now a bold new initiative called Land Change Monitoring, Assessment, and Projection (LCMAP) promises to fulfill that demand. Developed at the U.S. Geological Survey (USGS) Earth Resources Observation and Science (EROS) Center in Sioux Falls, South Dakota, LCMAP provides definitive, timely information on how, why, and where the planet is changing.
LCMAP’s continuous monitoring process can detect changes as they happen every day that Landsat satellites acquire clear observations. The result will be to place near real-time information in the hands of land and resource managers who need to understand the effects these changes have on landscapes.
“It’s a revolutionary approach to land cover mapping relative to what we have done in the past,” said John Dwyer, a Physical Scientist and LCMAP Project Manager at the EROS Center. “We’re going to enable research and application scientists to pursue lines of inquiry that have not been available in the past.”
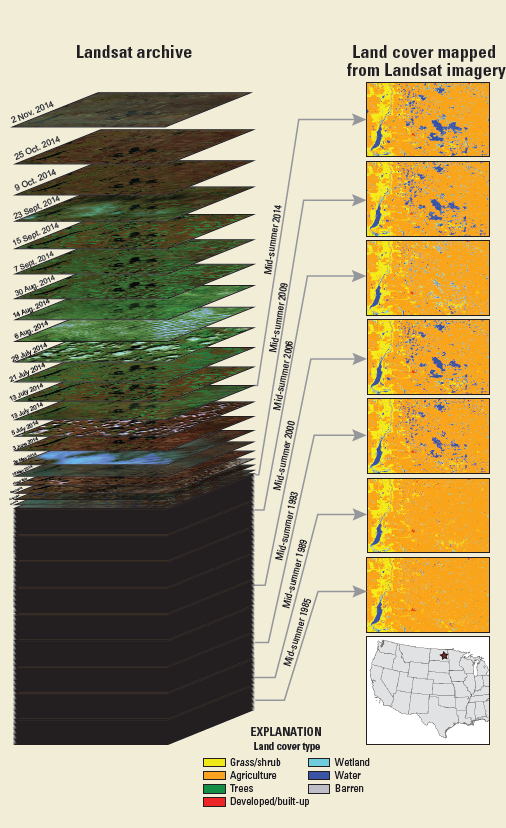
With free and open access to the global Landsat archive that dates back to 1972, LCMAP will characterize historical land change at any point across the full Landsat record. LCMAP will also be able to detect change in near real time thanks to an innovative algorithm called Continuous Change Detection and Classification (CCDC).
Dwyer describes the modeling algorithm as one “that takes us a big step forward in automation.”
“It’s what we’re using to really flag change on the landscape based on the spectral and temporal properties of the land cover,” Dwyer said.
Another important facet of LCMAP is the reprocessing of the entire Landsat archive into analysis- ready data (ARD). With that, LCMAP users will have access to seamless, pixel-based, orthorectified time-series data processed to both top-of-atmosphere (TOA) and surface reflectance measurements without spending hours doing the processing themselves.


All of those advantages have potential users lining up for an early sampling as the LCMAP initiative moves through testing and evaluation toward an initial public release at the end of 2017, indicated Tom Loveland, EROS’ Chief Scientist.
For example, with LCMAP’s continuous monitoring capability, as well as its historical time-series record, fire ecologists in Alaska are clamoring for this important tool that will help them prioritize when and where to address issues within the State’s vast wilderness areas, Loveland indicated.
USGS scientists working with the Chesapeake Bay Program in the eastern United States are another group interested in the promise of LCMAP, Loveland indicated, especially as they work with land owners to plant cover crops in the winter to prevent soil and sediment erosion into Chesapeake Bay.
“LCMAP provides them with a potential source for looking at changes, not just from year to year, but even within seasons, that may be particularly significant for affecting water quality,” said Loveland.
“If we can provide indications of where there are still bare soils in winter months, they have the opportunity to work with individual land owners to try to improve land management practices.”
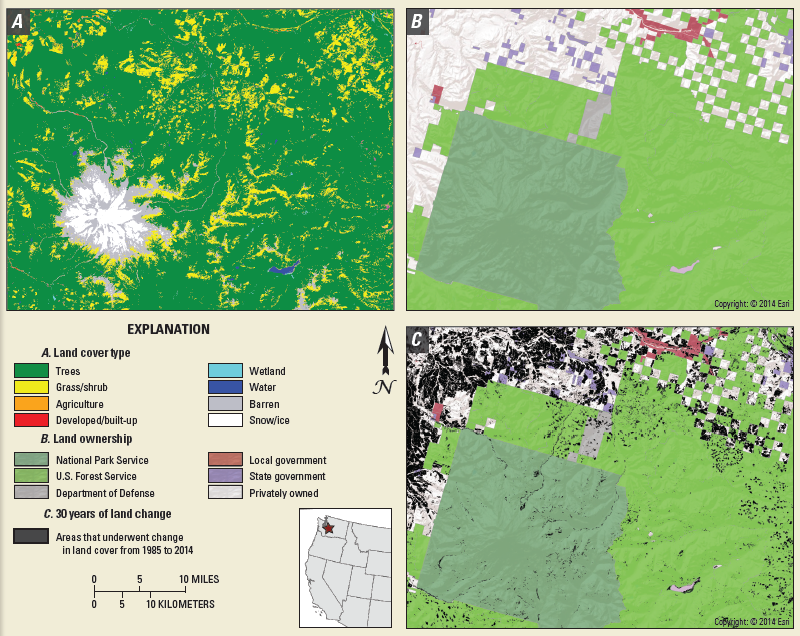
The idea is not to target specific user communities, according to Loveland, but to produce general purpose products that perform as the LCMAP name suggests—mapping and monitoring change; analyzing and assessing the rates, causes, and consequences of change; and providing scenario-based projections of future land change.
With LCMAP, managers of national wildlife refuges will have the ability to sign up for alerts when development on landscapes surrounding the refuges causes changes that may affect ecological systems within their boundaries, Loveland shared.
Likewise, the USGS Land Carbon program that monitors opportunities to sequester carbon in the country’s vegetation and soils could access LCMAP for timely information on land status and changes as a source for annual updates on the U.S. carbon budget.
In the long term, monitoring and assessing high frequency changes on the land will also produce a better understanding of the connections between land use, land cover, and climate variability, explained Loveland—everything from planting decisions based on weather patterns to how drought impacts wildfires.
“That’s one big area where I see LCMAP’s value… understanding the role that weather plays in shaping the natural resources of this country is important as we try to understand what the potential impacts of climate change may be,” Loveland said.
Though both USGS and the U.S. Department of Agriculture map land cover and land change across the entire conterminous United States on a regular basis, the appeal of the LCMAP initiative lies not in its competition with other land-mapping institutions, but in its collaboration with them.
LCMAP has embraced a number of developments created in universities and other governmental agencies. For example, the land change detection and land cover mapping capabilities in LCMAP were developed at Boston University, and the sampling and estimation procedures were developed at State University of New York-Environmental Sciences and Forestry.
South Dakota State University researchers have contributed ARD specifications and testing, and the U.S. Forest Service also is involved in developing and maintaining independent reference data for producing definitive land cover and land change statistics.
LCMAP’s similarities to Geoscience Australia’s work on the Australia Data Cube time-series project has EROS and the Australian agency discussing collaborative possibilities as well. Indeed, the broader international community seems very interested in analysis-ready data, and what LCMAP can provide on a global scale, Dwyer noted.
“All of the code and software we develop, we’ll make available as open source so other organizations can pick it up and run with it, too, whether it be government organizations, universities, or the commercial sector,” Dwyer said.
The goal, after all, is a greater understanding of the impacts of change across the United States and on landscapes around the globe. It takes such knowledge to embolden action. With the richness of its detail and the timeliness of its data, LCMAP promises to be an invaluable resource.
Reference:
Young, S.M., 2017, Land Change Monitoring, Assessment, and Projection (LCMAP) revolutionizes land cover and land change research: U.S. Geological Survey General Information Product 172, 4 p., https://doi.org/10.3133/gip172.


