

Using decades of Landsat satellite imagery, scientists at Geoscience Australia have mapped annual shoreline locations for the entirety of Australia going back more than thirty years. These nationally consistent maps show shoreline changes for all 21,000 miles (33,800 km) of the country’s coast, providing a catalog of management-relevant coastal trends.
By combining Landsat data with tidal models, researchers were able to map shorelines at mean sea level, creating a data set unbiased by tidal stage. In all, a cumulative 1.2 million miles (1.95 million km) of shoreline were charted and publicly released in April 2021 as an interactive map called Digital Earth Australia Coastlines.
The techniques used to create this valuable data trove are described in a recently published Remote Sensing of Environment paper and have been made publicly available for anyone to use for shoreline mapping across the globe.
Coastal Maps for a Coastal Nation
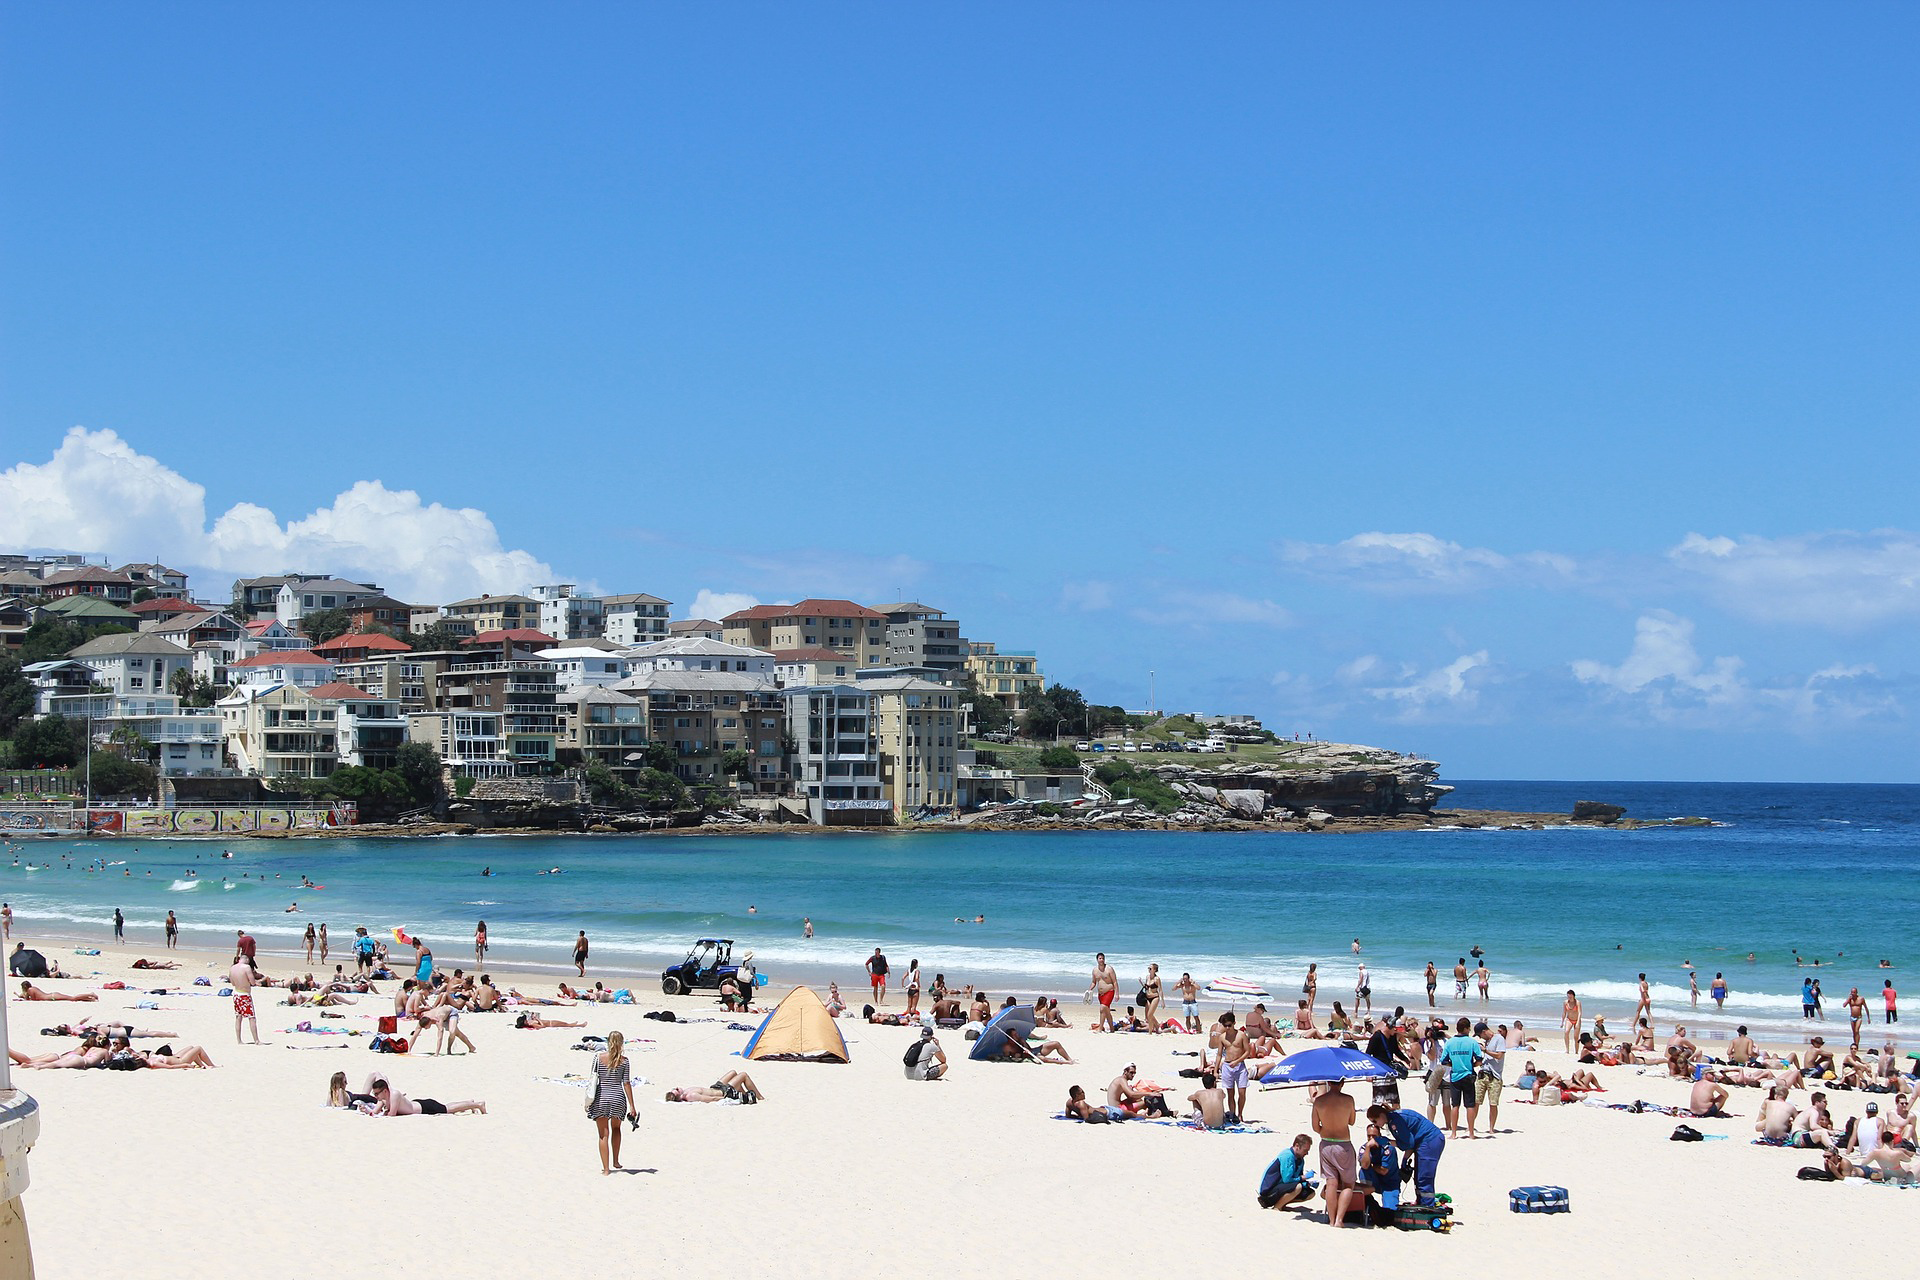
In a world of coastal dwellers—40 percent of the world’s population lives within 60 miles (100 km) of the coast—Australians are a particularly coastal people with some 90 percent of their population living within the same distance of the coast. The varied coasts of Australia include sandy stretches of beach, rocky cliffs, mangrove-flanked shores, and large tidal flats—all of which have now been annually mapped using Landsat.
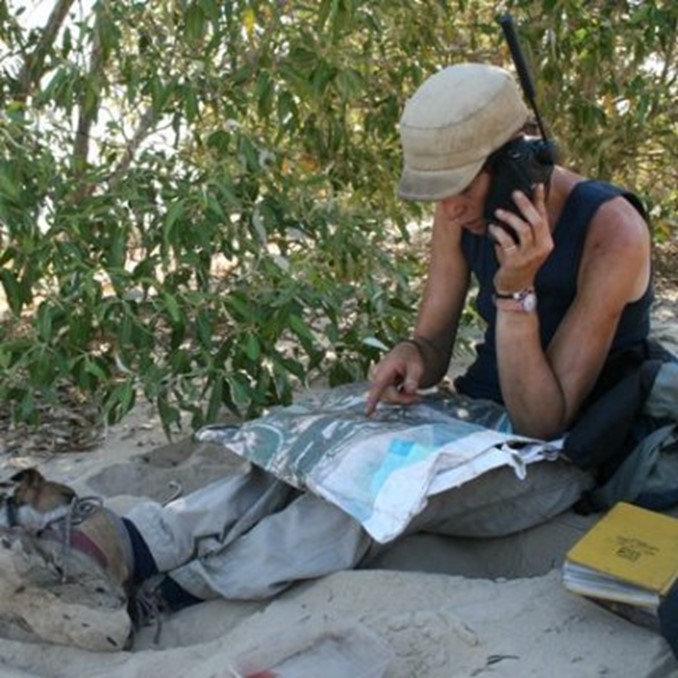
“Landsat’s rich temporal record is particularly important for countries like Australia with vast and remote coastlines that would be impossible to monitor regularly with more intensive methods like beach surveying or even aerial photography,” lead author and Geoscience Australia coastal Earth observation scientist, Robbi Bishop-Taylor describes.
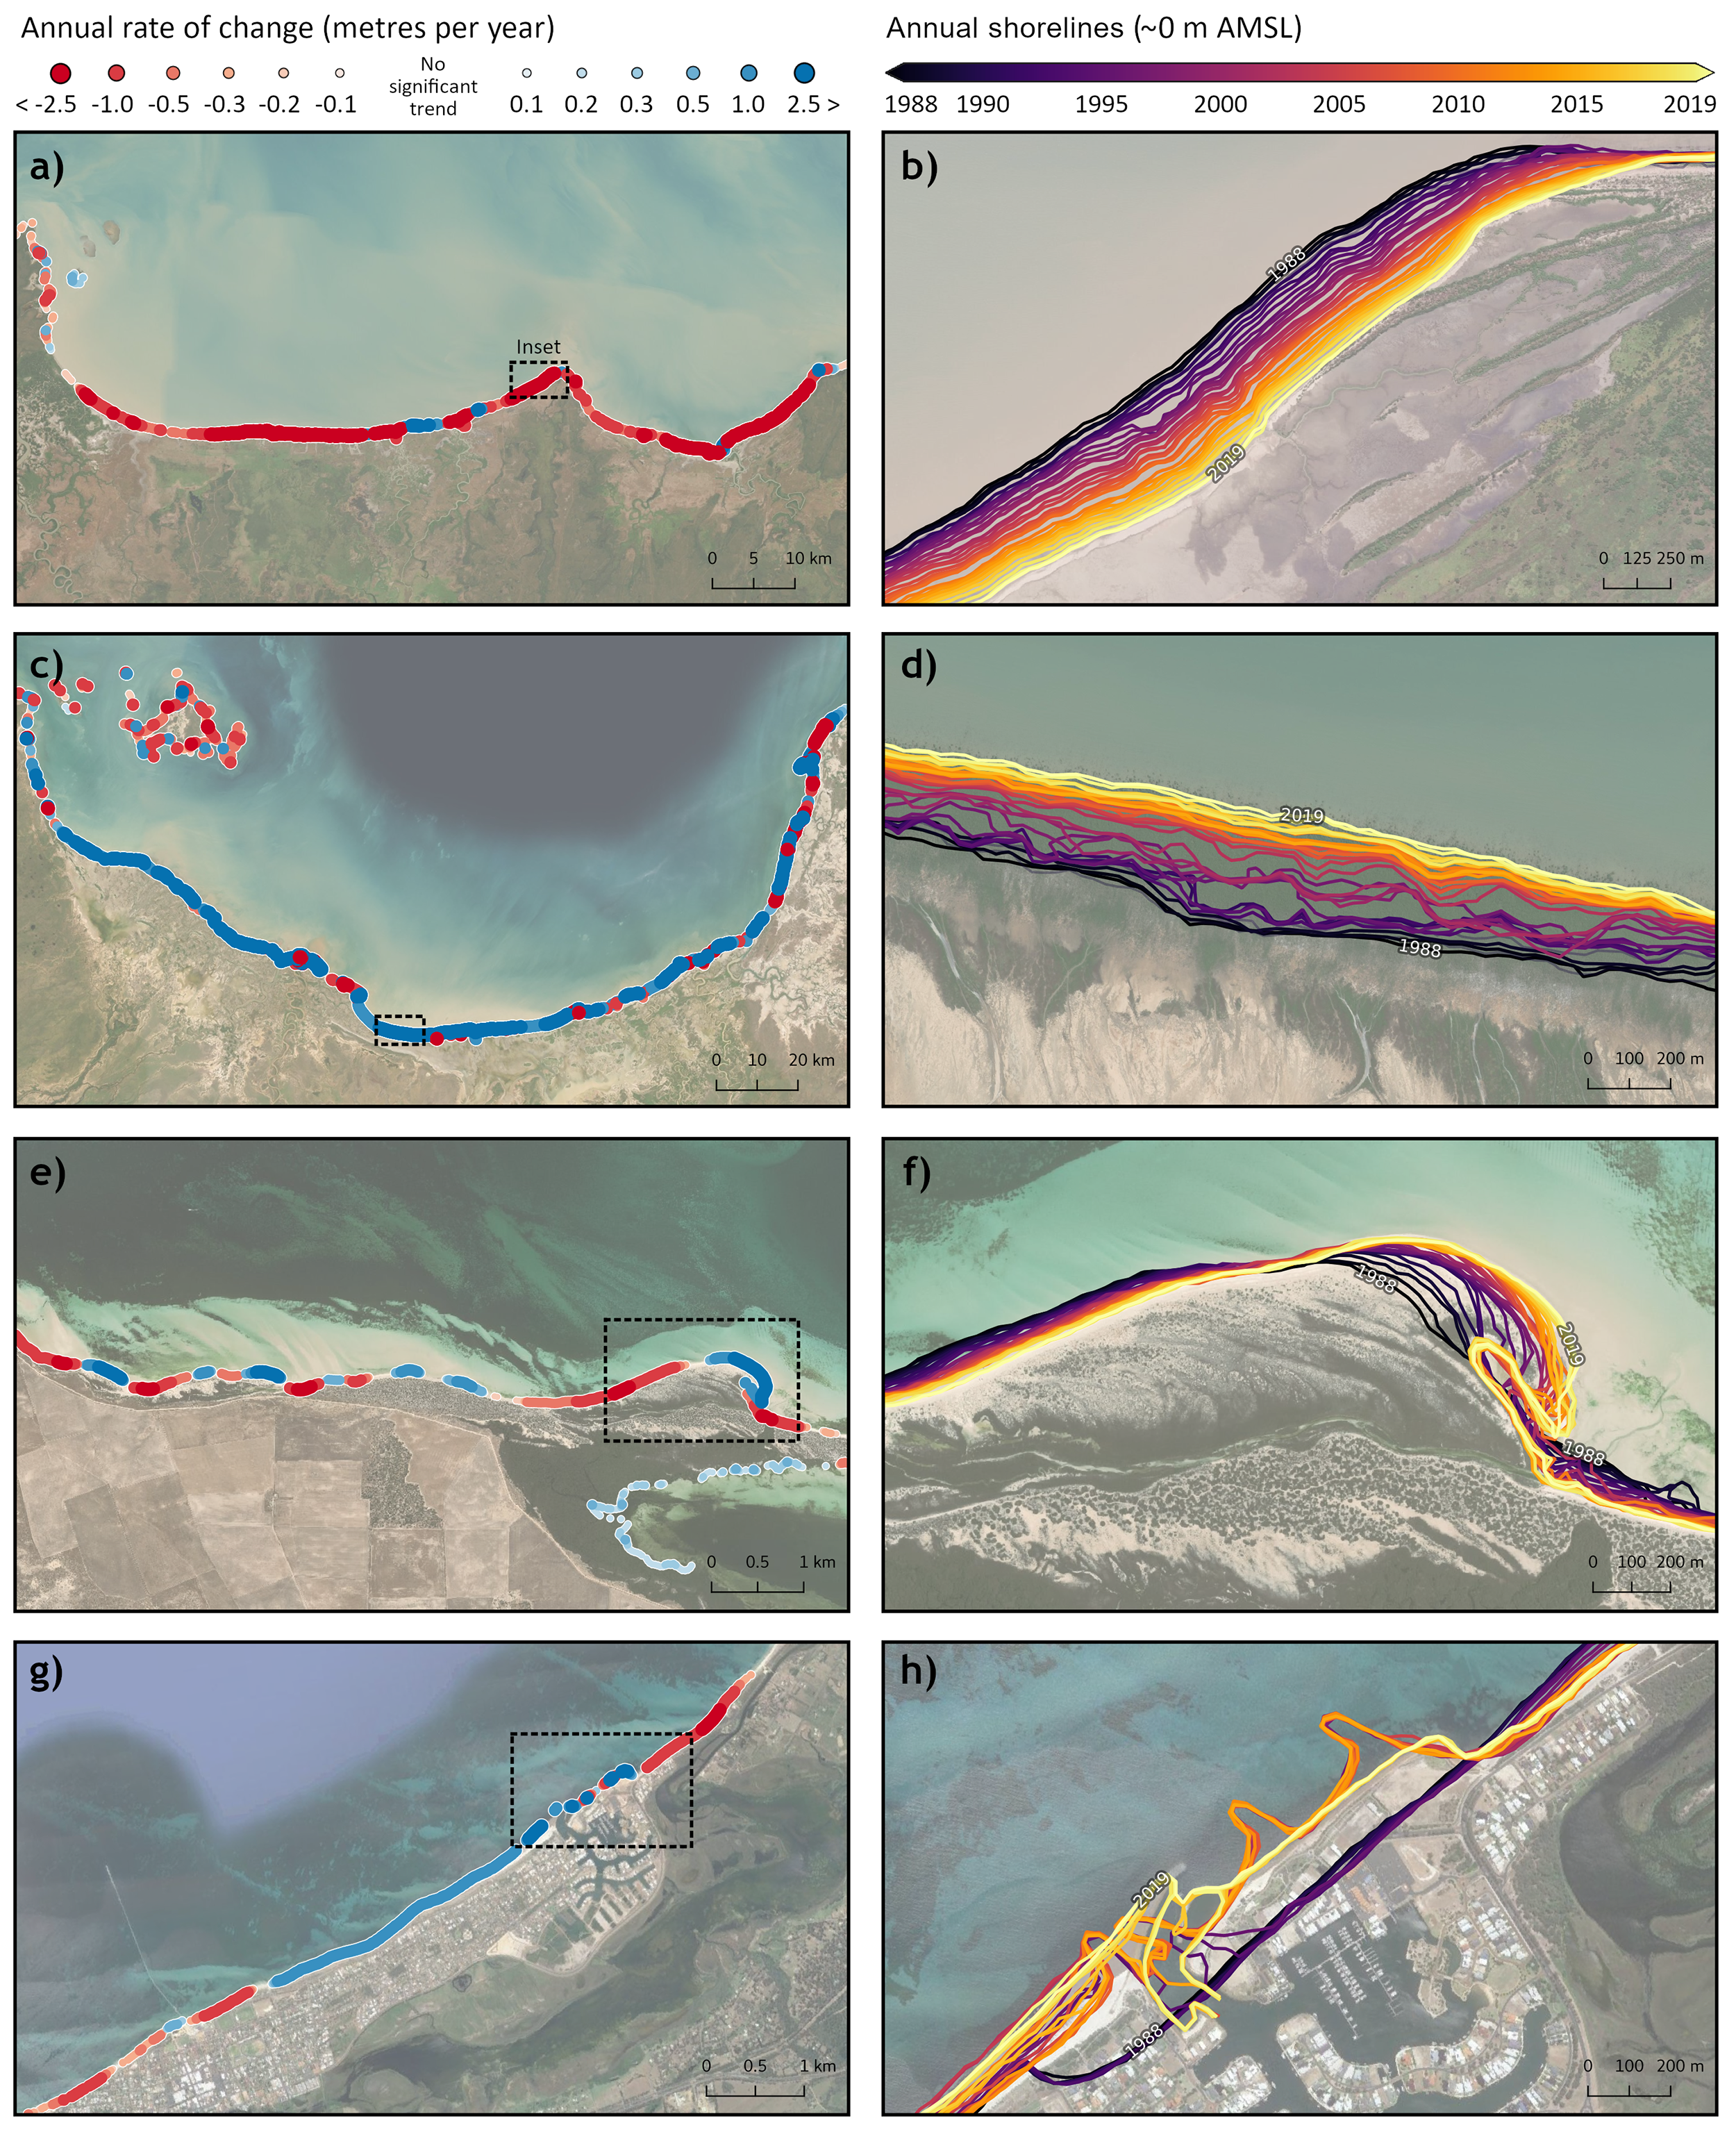
Bishop-Taylor and colleagues found that over a fifth of Australia’s non-rocky coastline experienced significant change over the last three decades; but overall, shoreline erosion and shoreline accretion—or growth—largely balanced each other out over this period.
Whereas houses have fallen into the sea as eroding sea bluffs collapse ~20 miles (30 km) north of Sydney, these new maps reveal that the mangrove-covered shores of the Gulf of Carpentaria in northeastern Australia have grown by as much as 9.8 meters (32 feet) per year since 1988.
“This is the first time anyone has undertaken such a detailed survey of a nation’s beach system using satellite imagery corrected for environmental and shoreline conditions,” Andrew Short, an Australian coastal geomorphologist unaffiliated with this research, remarks. “This provides a wealth of information on how each and every individual beach is behaving, which is critical information as we face rising sea level, changing wave climates, and changing beach sediments.”
Changing Climate, Changing Coasts
Beaches and shorelines are being reshaped by climate change. As catastrophic storms become more commonplace, coasts often take the brunt of punishing waves and storm surges; meanwhile, sea level rise continuously nips at the shore.
Australian assessments forecast that $29-45 billion (AUD $41-63 billion) of coastal property are at risk and that insurance premiums for these properties will increase exponentially over the next 80 years.
Effectively dealing with shifting shorelines and their impact on infrastructure requires readily available information about where, how much, and how fast coasts are changing. So, coastal agencies with incomplete historic records and limited information about local coastal trends will tremendously benefit from this new Landsat-based data set.
“Understanding the rates and types of coastal change are really important for supporting evidence-based management of Australia’s coastal zone,” explains co-author and Geoscience Australia geomorphologist Rachel Nanson. “Products like Digital Earth Australia Coastlines give confidence to coastal managers and coastal residents, who need to better understand coastal changes to make informed decisions.”
“It will enable every coastal manger in Australia to have a far better understanding of the beaches they are managing and how to plan for their future management of the coast,” Short posits.
Learning from Landsat
These essential maps were created with an innovative method developed by Geoscience Australia of connecting modeled tidal information to Landsat pixel data.
“There’s a huge amount of science you can do once you have satellite imagery combined with tidal information,” Bishop-Taylor describes.
When Geoscience Australia set out to create 30 years of nationwide shoreline maps to document how the Australian coast has changed and where it has changed the most, they needed to reach back in time and do so at a continent-wide, yet locally relevant, scale.
“The only satellite platform that lets us meet both of these goals is Landsat,” Bishop-Taylor explains. “The Landsat program provides an unparalleled historical record of coastal observations that captures how the world’s coastlines have changed over time in incredible detail.”
“Being able to access decades of regularly acquired and consistently calibrated Landsat data for even the most remote and inaccessible regions of Australia has been critical for our shoreline mapping method.”
Better than a Pixel
With Landsat’s dense archive of data to draw from, Bishop-Taylor and his colleagues at Geoscience Australia came up with a remarkable method to overcome the spatial resolution limitations that have previously limited Landsat’s use for annual shoreline surveys. When working with 30-meter pixels, annual shoreline change—which is often less than the baseball diamond-size of a Landsat pixel—can be difficult to discern when comparing one satellite image to another.
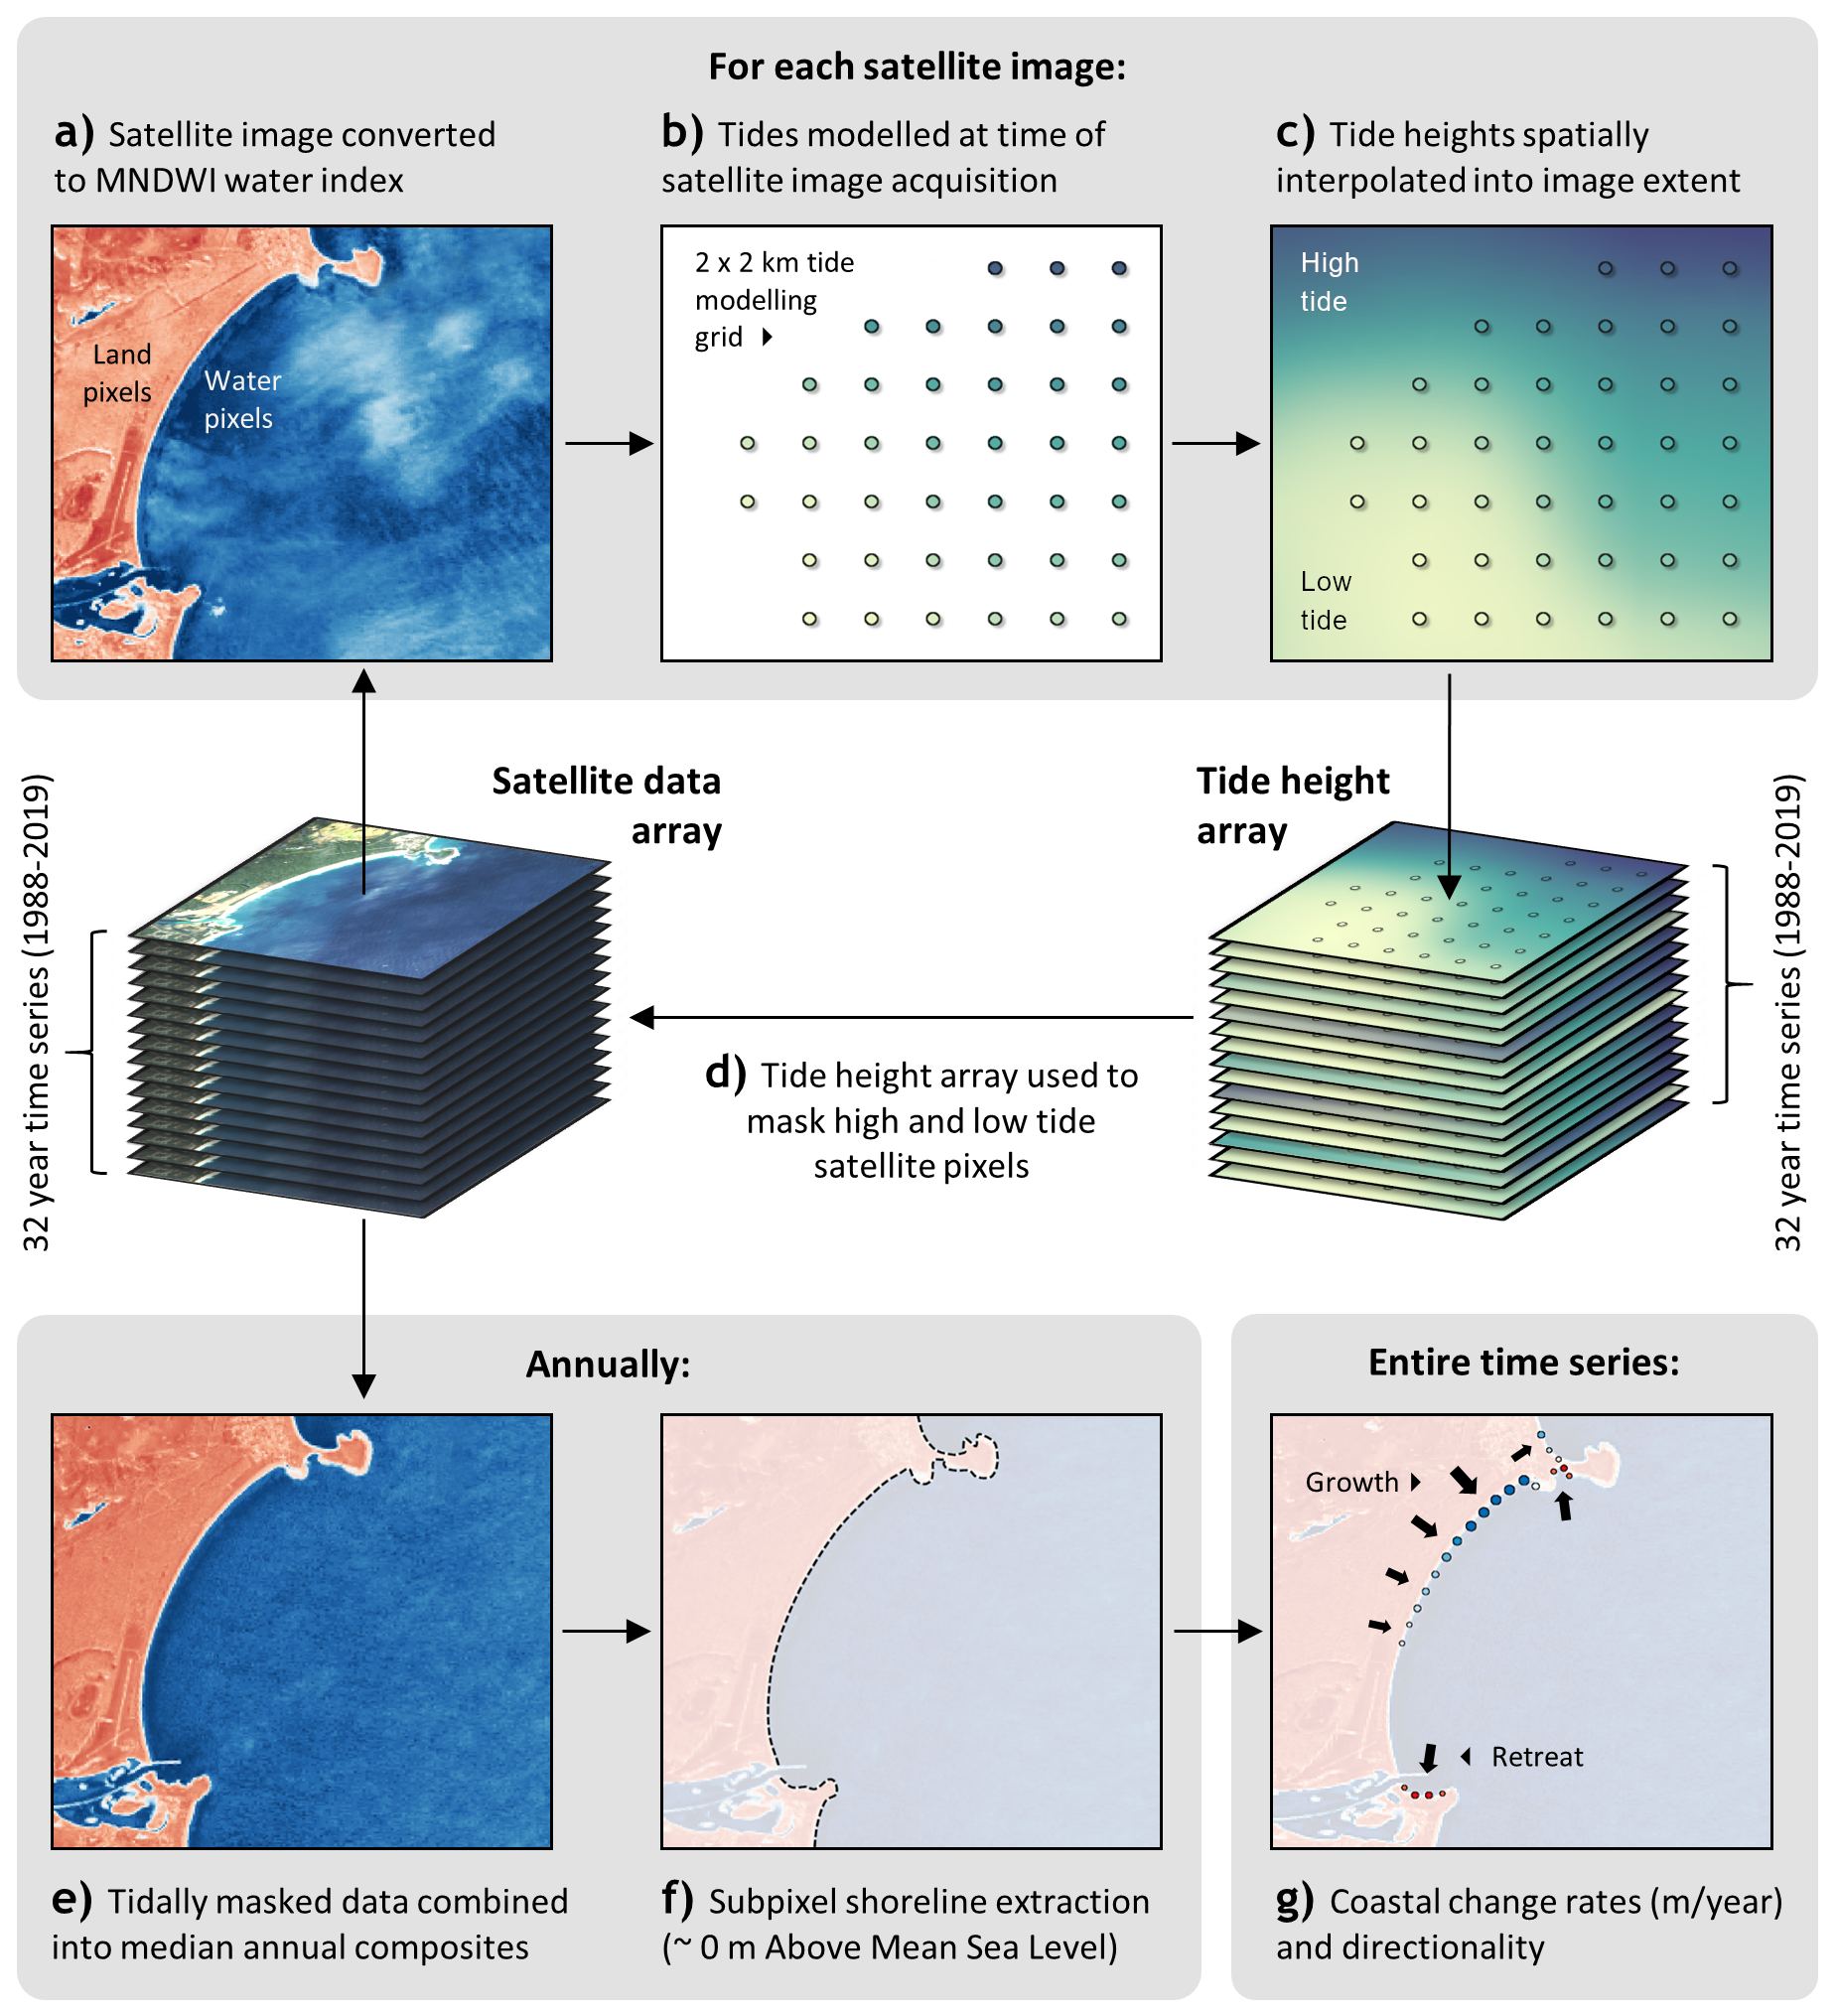
Bishop-Taylor and the Geoscience Australia team developed a way to locate subpixel waterlines by using pixel “wetness” (found using an index known as the Modified Normalized Difference Water Index that compares the difference in green and shortwave infrared reflectance measured by Landsat) to locate shoreline positions, and then taking the median position of all Landsat shoreline observations made each year when the tide was near mean sea-level.
“Our approach uses small differences in the wetness of neighboring satellite pixels to identify the precise position of the shoreline at ‘subpixel’ resolution,” Bishop-Taylor explains.
After a massive validation effort that included comparing the Landsat-derived shoreline locations to nearly 58,000 data points from field surveys, lidar measurements, aerial photographs—and even citizen science drone data–the cartographic accuracy of the new maps was verified and long-term rates of change as small as one foot (0.31 m) per year were confirmed.
Open Science
Open Landsat data has ushered in an era of greater understanding of Earth. With many minds harnessing decades of calibrated, geolocated (“science-grade”) Landsat Earth observation data, improved maps, environmental alerts, and a deeper understanding of climate change repercussions have followed.
Digital Earth Australia and its outputs like the coastline evolution maps are an example of the progress enabled by the open data renaissance.
“The foundation of the Digital Earth Australia program can be traced back to when USGS released the publicly available Landsat data in 2009,” Stephen Sagar, a co-author and lead of the aquatic remote sensing team at Geoscience Australia, shares.
Bishop-Taylor continues, “Landsat’s free and open data policy allows our coastline mapping methods to be easily scaled up and applied to other coastal regions, lowering barriers to understanding recent patterns and processes of coastal change globally.”
In the same spirit of open-source data, Geoscience Australia supports open science and the sharing of its analysis techniques and data processing code.
Previous satellite mapping methods developed and shared by Geoscience Australia, are now helping to protect United Kingdom coastlines thanks to Scotland’s Dynamic Coast erosion risk-assessment tool, known as Coast X-Ray. Coast X-Ray (which uses ESA’s Landsat-like Sentinel-2 satellite data) also maps and monitors intertidal habitats, flags stretches of shoreline where surveyed beach measurements need to be updated, and provides information on shoreline behavior.
“The open-source approach taken by Geoscience Australia allowed for the efficient and rapid development of Coast X-Ray by our small project team, which resulted in the production of a number of outputs that can inform coastal adaptation across the UK and Ireland,” says James Fitton, a researcher who as an Honorary Research Fellow at the University of Glasgow helped create Coast X-Ray.
“The technology used in Digital Earth Australia Coastlines can be applied anywhere in the world,” Short remarks.
Already, shorelines in Africa are being mapping using this technology. As part of the Committee on Earth Observation Satellites (CEOS) initiative known as Coastal Observations, Applications, Services, and Tools (COAST), Geoscience Australia has transferred their mapping methodology to Digital Earth Africa for use with its Landsat-based open data cube—enabling both historic and ongoing monitoring of the highly-populated and dynamic coasts of West Africa.
Landsat 9: Charting the Future
On September 27, 2021, NASA and USGS successfully launched the Landsat 9 satellite which is currently in its on-orbit checkout period. When checkout concludes in January, USGS will take over satellite operations and all Landsat 9 data will become publicly available.
“The key benefit of Landsat 9 will be the increased frequency of well calibrated observations we will have access to when paired up with Landsat 8,” Sagar says. “Having a higher temporal density of scenes to work with will enable us to map future annual coastlines more accurately, particularly in regions that are routinely impacted by cloud cover.”
With the addition of Landsat 9 data, Geoscience Australia may even be able to create shoreline maps multiple times per year, a development that would help capture seasonal coastal dynamics for stakeholders.
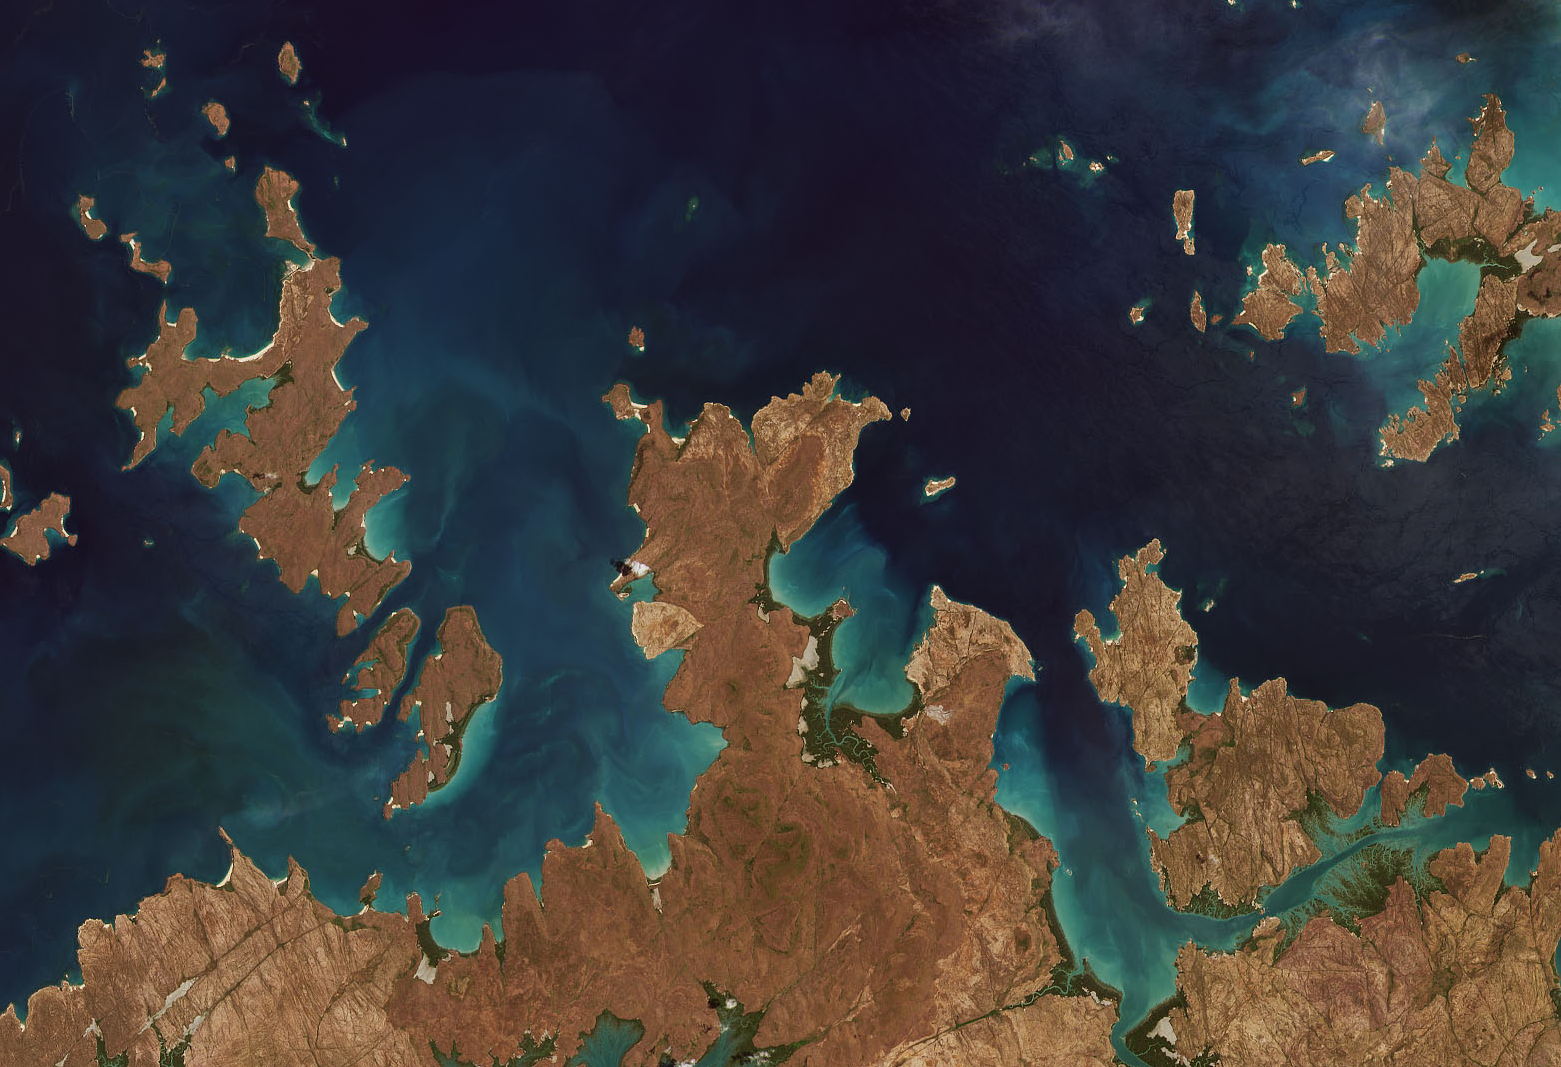
In an interesting bit of serendipity, when Landsat 9 opened its shutters for the first time on Oct. 31, the first light to hit its detectors was that of Australia’s northern Kimberly coast. A coastal region that is in many places accessible only by sea, yet nonetheless a coast that Geoscience Australia maps annually by virtue of continuing generations of open Landsat satellite data.


