
Dr. Jillian Deines is a postdoctoral scholar at Stanford University’s Center for Food Security and Environment. Here is what Jill shared with us about the work she is presented at #AGU18:
Shifting irrigation patterns in response to policy, technology, and water availability: Mapping three decades of irrigation across the US High Plains Aquifer with Landsat satellite data
What are the major findings of this research?
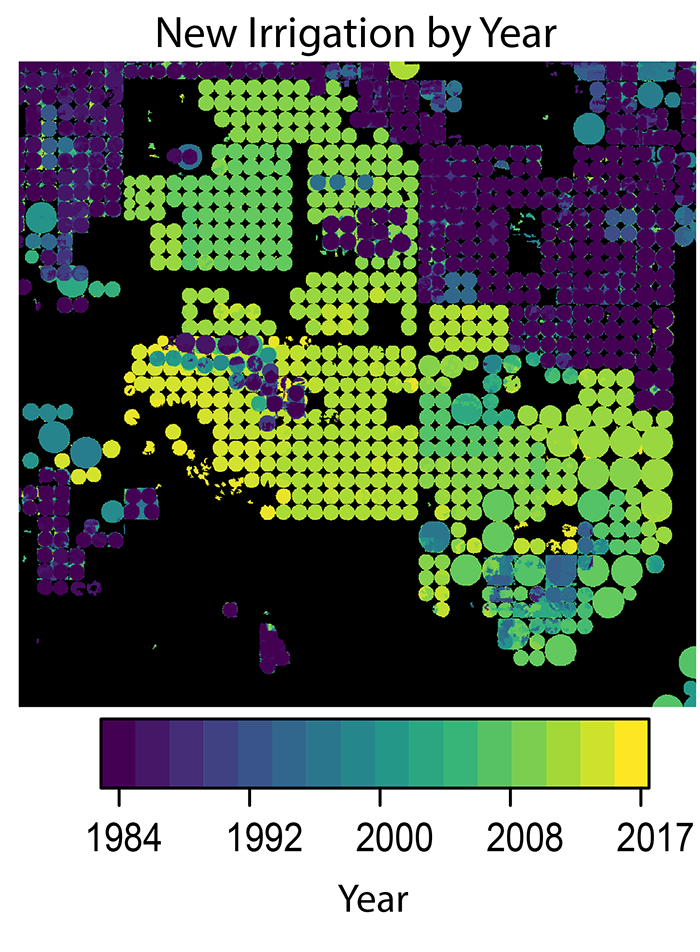
We developed a method to use the full Landsat archive to produce annual maps of irrigated area over the High Plains Aquifer in the central United States. The resulting 34-year map dataset provides a rich and detailed accounting of irrigated lands across one of the key agricultural regions of the United States.
Our broad-scale analyses found ongoing irrigation expansion across the full aquifer, including areas of high water stress. We also found regions of declining irrigated area, with indications that falling groundwater yields have curtailed irrigation in some regions. Assuming continued water use trends and management, we estimated that existing irrigated area could decline by 24% over the 21st century due to groundwater depletion.
What are the implications of your findings?
Knowledge of where and when irrigation occurs is critical for effective management and hydrological modeling, yet data on patterns of irrigation through time are surprisingly rare. Our findings allow us to better understand how irrigation water needs and behavior change based on factors such as climate, technology, and increasing regulation. Understanding these relationships will help resource managers maximize crop yield, farmer profit, and water savings.
What insight did you gain from Landsat that would have been difficult to ascertain otherwise?
The longevity of the Landsat satellite series allowed us to use consistent methods across multiple decades. This maximizes the accuracy of our product and allows us to analyze trends across many years. With continued Landsat missions, our dataset can easily be extended as new years are acquired.
Can you explain what the Neighborhood Greenness Index is?
Our study region covers a large precipitation gradient, so the distinction between rain-fed and irrigated crops is not consistent over this large region. We developed the Neighborhood Greenness Index to normalize crop greenness by the local region, thus emphasizing the relative differences between rain-fed and irrigated crops and increasing consistency across the study area. Neighborhood normalization of greenness may thus be a promising avenue for future continental to global-scale efforts.
Where can interested data users find the High Plains Aquifer irrigation record / map dataset you developed?
The dataset will be open and publicly available upon publication of the work, which is currently under peer review. Future users can find it on Hydroshare or access it on Google Earth Engine. Annual maps from a previous project which laid the foundation for this work are currently available on Hydroshare.
Co-authors:
Anthony D Kendall
Michigan State University
Morgan Ann Crowley
McGill University
Jeremy Robert Rapp
Michigan State University
Jeffrey A Cardille
McGill University
David W Hyndman
Michigan State University
Funding was provided by NSF grant WSC 1039180, USDA NIFA grant 2015-68007-23133 and USDA-NIFA/NSF INFEWS program grant 2018-67003-27406 (accession # 1013707). Jillian Deines was partially supported by NASA Headquarters under the NASA Earth and Space Science Fellowship Program grant 14-EARTH14F-198. Any opinions, findings, and conclusions or recommendations expressed in this material are those of the authors and do not necessarily reflect the views of NSF, USDA NIFA, or NASA.
Anyone can freely download Landsat data from the USGS EarthExplorer or LandsatLook.
Further Reading:
+ How Much Water Flows into Ag Irrigation? Landsat Knows
+ Mapping Croplands Over the U.S. High Plains Aquifer
+ Landsat at #AGU18


