
Dec 12, 2019 • Dr. Shaul Hurwitz is a Research Hydrologist at the USGS Volcano Science Center in Menlo Park, CA. Here is what Shaul shared with us about the work he presented on Wednesday afternoon at #AGU19:
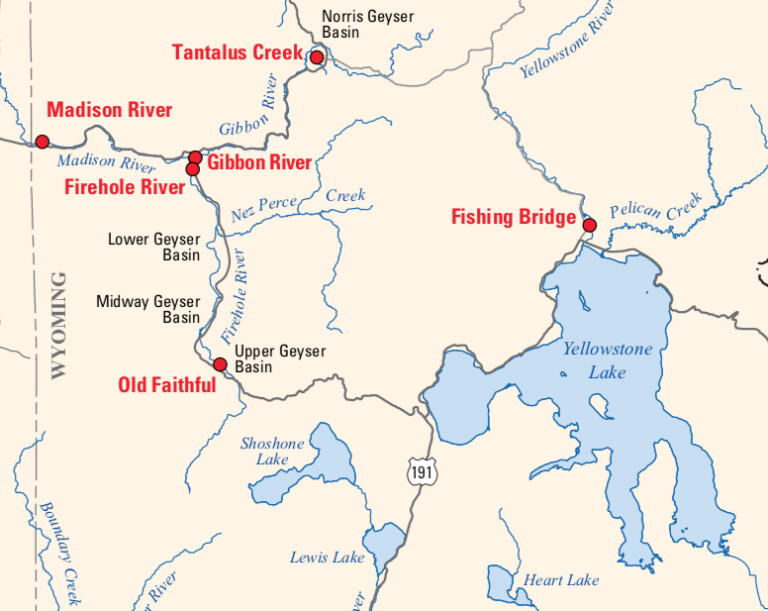
Hydrothermal Activity in Southwestern Yellowstone National Park
Why is it important to have a broader understanding of Yellowstone Plateau Volcanic Field?
The Yellowstone Plateau Volcanic Field is huge, and we don’t know where (and when) the next unrest (manifested by seismic swarms, deformation of the ground surface and/or emissions of volcanic gases) will take place. To better assess the hazards, we need to better understand and characterize activity in the entire volcanic field. In this study, we characterized the distribution of heat and gases that are possibly released from an underlying magma.
What are the major findings of this research?
We found that the thermal waters we sampled started off as rain that seeped into ground and became groundwater. These thermal waters had chemical and isotopic compositions that were indicative of the different rock types, dissolved gases, and temperature changes the water encountered along its journey.
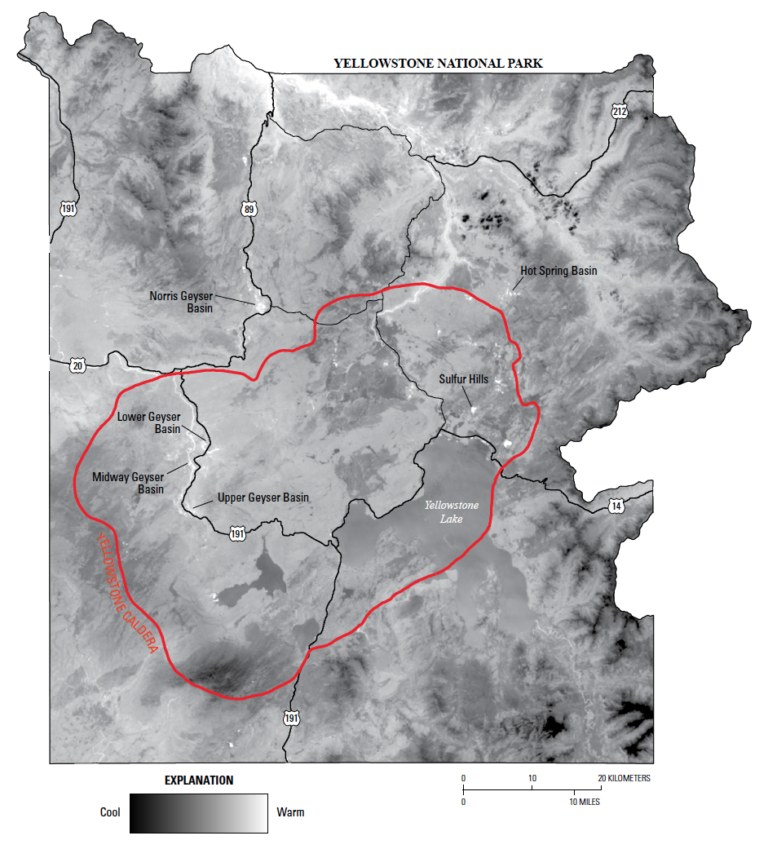
The lack of shallow magma in southwest Yellowstone Plateau Volcanic Field, or YPVF, (based on geophysical imaging) suggests that heat discharge by springs and fumaroles originates from within the Yellowstone Caldera. Heat and magma-derived gases are then transported laterally across the inferred Yellowstone Caldera boundaries.
Gas compositions resemble the compositions from other parts of the YPVF.
The helium isotope ratios are similar to the ratios in gases from the Yellowstone Caldera and have magmatic values.
NASA/USGS Landsat played a small role in this research, what information did the data provide that would have been difficult to ascertain otherwise?
The Landsat data guided our field expeditions and provided a quantitative assessment of the radiative heat flow from the different thermal areas.
Will Landsat-based thermal infrared monitoring of YPVF continue?
Absolutely! Greg Vaughan has been analyzing satellite-based thermal images of Yellowstone for the past few years and will continue to do it for the Yellowstone Volcano Observatory.
From co-author R. Greg Vaughan:
Yes, satellite-based thermal infrared monitoring of Yellowstone’s thermal areas will continue. We use both Landsat 8 and ASTER thermal infrared data. We also hope to begin regular acquisition of higher spatial resolution airborne thermal infrared images as well.
Co-authors:
Richard Blaine McCleskey
U.S. Geological Survey
David A Roth
U.S. Geological Survey
Deborah Bergfeld
USGS Volcano Science Center
Sara Peek
USGS Volcano Science Center
David Susong
USGS Utah Water Science Center
Erin B White
Yellowstone National Park
Jefferson D G Hungerford
National Park Service
Lauren Harrison
National Park Service
Behnaz Hosseini
National Park Service
Richard Gregory Vaughan
US Geological Survey
Andrew G Hunt
U.S. Geological Survey, Denver Federal Center
James B Paces
USGS
Thanks to Michael Poland, the Scientist-in-Charge at Yellowstone Volcano Observatory, for help with the imagery above.
Note: Co-author Dr. R. Greg Vaughn gave a related talk on AGU on Tuesday afternoon titled:
“The Emergence of a New Thermal Area in Yellowstone.”
Here is his summary of that talk:
A previously unmapped thermal area was discovered in Yellowstone in 2018 using a Landsat 8 nighttime thermal infrared image. The area is located near the northeast margin of the Sour Creek Dome, between Tern Lake and a previously known thermal area of the same name. It is currently about 8 acres in size and located deep in the backcountry.
Analysis of archived remote sensing data sets suggests that the area started emerging around 2001. The emergence of a new thermal area is exactly the sort of behavior we expect from Yellowstone’s dynamic hydrothermal system and it reminds us that changes are always taking place, sometimes in remote and generally inaccessible areas of the park.
A combination of satellite and airborne remote sensing data were used to characterize this new area, and a field mapping expedition was conducted in August 2019.
Further Reading:
+ Discovering New Thermal Areas in Yellowstone’s Dynamic Landscape
+ Landsat at the 2019 AGU Fall Meeting
Anyone can freely download Landsat data from the USGS EarthExplorer or the LandsatLook Viewer.


