
December 11, 2019 • Dr. Christopher Shuman is a glaciologist with NASA Goddard Space Flight Center and the University of Maryland at Baltimore County. Here is what Chris shared with us about the work he is presenting today at #AGU19:
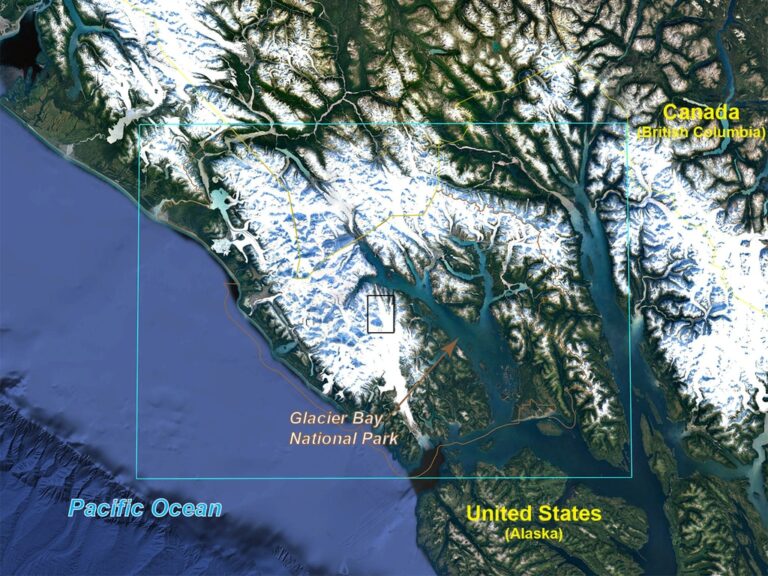
Decades of Change at Glacier Bay National Park, Alaska, Visualized from Repeat Satellite Imagery
What information has the 46-year NASA/USGS Landsat time series of the Glacier Bay National Park region provided to staff working at the park?
Seeing the 1972 to 2018 (now 2019) park-wide Landsat mosaics for this part of southeast Alaska, and a nearby portion of British Columbia, has enabled the Interpretive Division Park Rangers to more fully understand and communicate how this part of Earth’s landscape is changing, especially during recent melt seasons.
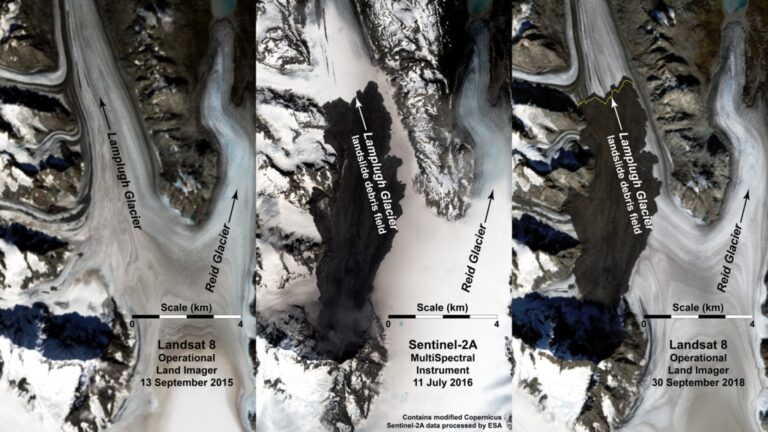
The assembled imagery series—each composed of four Landsat scenes—shows widespread glacial melt and increased debris covered ice; glacier flow changes; ice front retreat; and recent landslides, some of which were news to park staff.
Six areas with close-up Landsat views further enable the rangers to show these widespread glacier and landscape changes in more detail, including from some of the areas where cruise ships take the many hundreds of thousands of visitors within the park each year.
Why is this information useful to them?
One ranger who recently visited NASA Goddard Space Flight Center for the Earth to Sky Academy stated that these images and my glaciologic interpretation of them completely transformed how they talk about glaciers at the park.
The dramatic changes mentioned above, not particularly evident from the ground or the deck of a cruise ship, came into sharp focus when viewed using the time series of Landsat satellite images.
What insight do people gain from Landsat that is difficult to ascertain otherwise?
In short, Landsat makes it possible to compare images over almost 5 decades and makes the role of climate change unmistakable in this incredibly beautiful mountainous part of Alaska. By good fortune, there was enough imagery from Landsat 1 in 1972 (still called ERTS-1 at that time) to show the entire Park during the same August-September timeframe that now produces widespread melting.
Clouds are very common across coastal Alaska so to be able to begin the time series at the start of the Landsat-era ~47 years ago, almost a lifetime, was remarkable.
What is the benefit of working with ASTER, Landsat and Sentinel-2 together?
Working with two colleagues, Mark Fahnestock at UAF and Etienne Berthier at LEGOS, has enabled ancillary data sets to further expand the story of change at the Park.
Mark has been an integral part of the ITS_LIVE project that generates ice velocity maps using Landsat data and these maps show how some of the ice has been changing in flow speed since the mid-1980s.
Etienne is a specialist in mountain glaciers and generated crucial ASTER DEMS from 2000 to 2019. Differencing these DEMs shows an average elevation loss of 0.82 m/yr over the ~6200 square kilometer ice area within and nearby Glacier Bay National Park. By converting the initial ice elevation change to this water-equivalent change, we have calculated that the Park area is losing ice at ~ 5 Gt/yr (5 cubic kilometers/yr) over almost 2 decades.
Sentinel-2’s highest-resolution data make beautifully clear natural color composites that show landscape features in even more detail including the Park Headquarters at Glacier Bay.
Co-authors:
Etienne Berthier
LEGOS, Univ de Toulouse, CNES, CNRS, IRD
Mark A Fahnestock
University of Alaska Fairbanks
Funding was provided by NASA Headquarters and this project was enabled by the Earth To Sky Interagency Partnership between NASA and the National Park Service. Special imagery support with an early Landsat scene was provided by Jim Storey (KBR Wylie).
Related reference:
Berthier, E., C. Larsen, W. J. Durkin, M. J. Willis, and M. E. Pritchard. 2018. “Brief communication: Unabated wastage of the Juneau and Stikine icefields (southeast Alaska) in the early 21st century.” The Cryosphere 12 (4):1523-1530. doi: 10.5194/tc-12-1523-2018.
Further Reading:
+ 2016 Lamplugh Glacier Landslide in Glacier Bay National Park (video available)
+ Landsat at the 2019 AGU Fall Meeting
Anyone can freely download Landsat data from the USGS EarthExplorer or the LandsatLook Viewer.


