
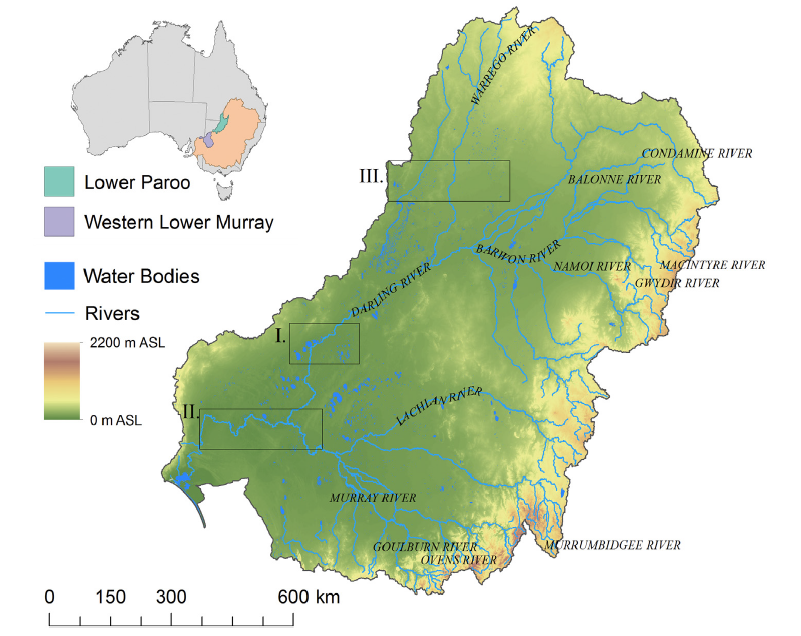
In Australia, that driest of inhabited continents, water weighs on the minds of many. This is especially true in the country’s semi-arid breadbasket, a nearly 250 million-acre area (~1,000,000 square kilometers) in the southeastern quadrant of the continent, known as the Murray-Darling Basin. The Basin is responsible for half of Australia’s wheat production, home to a quarter of its cattle and half of its sheep.
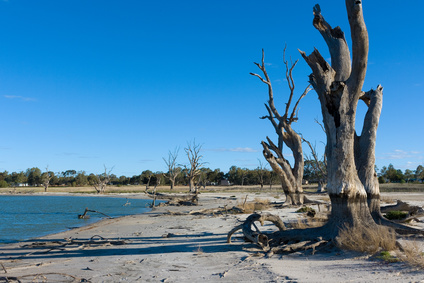
Boom-and-bust water cycles are a part of life in the Basin, but in the last quarter of a century those extremes have gotten worse. Starting in 1999, a crippling decade-long drought, dubbed the Millennium Drought, brought financial ruin and environmental disaster to the region as severely limited water resources caused crops to languish and turned many of the region’s ecologically important wetlands into salty, acidic dead zones. This record-setting drought was then followed by record-breaking floods from the 2010-11 La Niña event.
From the ashes of the drought, a new federal agency called the Murray-Darling Basin Authority was born with the directive to balance the region’s water extremes with the competing needs of agriculture, environment, industry, and residents.
The Murray-Darling Basin Authority, or MDBA, is part of a $10 billion (Australian) investment in the future of water. The MDBA has the job of setting Sustainable Diversion Limits—which involves figuring out how much water can be used for irrigation and how much water needs to be reserved for “environmental flows” which mimic the natural flooding and serve as lifelines for native vegetation. To get these sustainable diversion limits right, the MDBA needs to fully understand the region’s water and vegetation dynamics.
Now, for the first time, Basin-wide information on the response of floodplain vegetation to available water is in hand, filling a major knowledge gap. Using a quarter century of Landsat data, geospatial researchers at the Geospatial Analysis for Environmental Change Lab at the University of New South Wales (UNSW) have mapped and modeled how vegetation responds to water availability across the entire Murray-Darling Basin. This work has just been published in Remote Sensing of Environment.
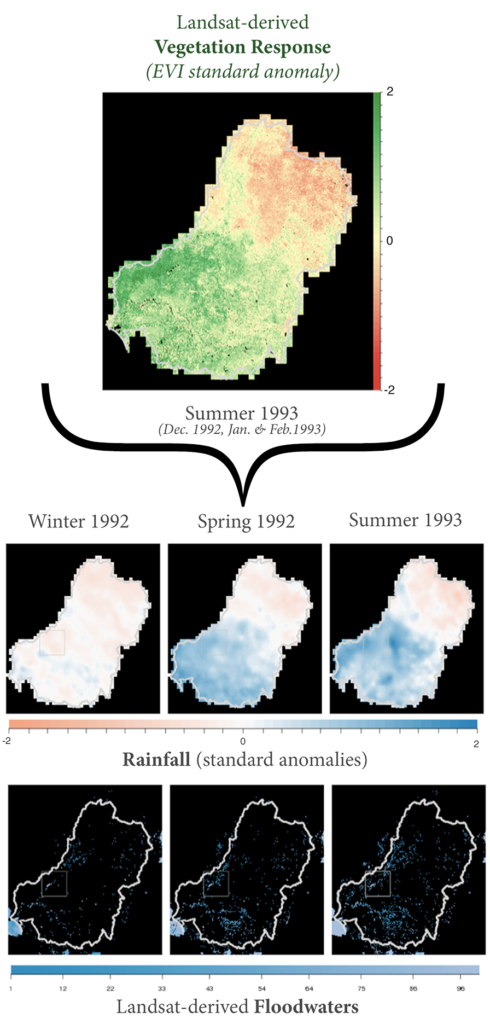
Lead author Dr. Mark Broich used the historic Landsat data record to watch both where and when vegetation green-up occurred in the Basin, modeling how that green-up varied with rainfall and flooding patterns and documenting how this response relationship changed over time. His work showed that the onset of the Millennium Drought caused dramatic shifts in the spatial patterns of vegetation response and the role of flooding.
Rainwaters, Floodwaters
A number of prior studies have attempted to tease out if rainfall or flooding in the Basin is the main driver of vegetation greening; they often came to different conclusions.
By harnessing the existing wall-to-wall Landsat data coverage for the Basin, Broich and his team at UNSW’s Geospatial Analysis for Environmental Change Lab were able to provide the first full-Basin look at how the floodplain vegetation utilized and responded to available water. What they found was that rainfall and flooding worked synergistically and in traceable and distinct spatial patterns.
“Combined effects of rainfall and flooding were found to be the primary driver of vegetation response; if one occurred without the other, any effect was reduced,” Broich explained.
Broich’s team found that vegetation response within the Basin varied greatly with location. Flooding was much more influential in downstream areas. Most regions experienced flooding very infrequently; in those places rainfall was king green-maker, but in downstream regions, this relationship was flipped.
Downstream floodplain locations flood more often since they receive the aggregate drainage of all of their upstream river networks—in other words, they “catch” the collective water of their catchment (drainage basin).
This also means that peak floods in these regions rarely happen at the same time as local rainfall since there is a lag time between when rain falls upstream and when it shows up downstream.
Just Add Water
Three-quarters of Australia’s irrigated lands are found in the Murray-Darling Basin; those lands are responsible for 40 percent of Australia’s agricultural production. But non-irrigated regions rely on the Basin’s scarce water resources as well. Scattered throughout the Basin are over 200 wetlands nationally recognized as biodiversity hotspots, and 16 of the Basin’s wetlands are listed as internationally recognized Ramsar Convention sites.
Services provided by these environmental assets include water filtration, runoff regulation, biodiversity protection, and carbon and methane sequestration—services that have been calculated globally to be worth some $1.2 million per square kilometer (~250 acres).
Insuring that the scant water of the semi-arid Basin can protect both farms and wetlands is a delicate—but imperative—balancing act, especially given the drier future predicted. This is where Broich’s work comes in. By mapping out the historical patterns of floodplain vegetation response to water availability, water managers get a quantifiable idea of how important flood magnitude and timing is for maintaining vegetation health. This provides water managers with valuable insights into how much water they need to release as environmental flows during drought years and what the frequency of those water pulses should be.
“That’s the beauty of Landsat—it allows us to quantify these spatial patterns that are of high interest to water managers,” Broich said.
The native floodplain vegetation has a lifecycle that includes going dormant during dry spells and then quickly greening in wet times. Broich’s finding that flooding two season’s prior triggered a significant increase in vegetation greenness gives water mangers a peak into the mechanics of soil moisture recharge time and the vegetation’s response to it.
An Archive of Consequence
The historic and continuous nature of the Landsat data archive is what enabled Broich and Tulbure’s team to measure this vegetation response in terms of timing, magnitude, and location.
“Thanks to Landsat program satellites, we can nowadays focus on phenomena such as droughts and floods that occur over both short and multi-decadal time frames and impact large regions at a spatial resolution relevant for local management,” Broich observed.
As an eight-year old in 1986, Broich didn’t pay much attention when the Australian International Ground Station started downlinking the new 30-meter resolution data from the second generation Landsat satellite series, but that decision to exhaustively collect all data over the continent from the new Landsat thematic mapper sensor set in motion the data repository that gave Broich the ability to do this research.
Broich used over 25,000 Landsat 5 and 7 images collected between 1986 and 2011 in concert with rainfall data from the Australian Bureau of Meteorology to create his Basin-wide vegetation response maps.
Because of Landsat’s long data record, Broich was able to map vegetation dynamics over a quarter century. He used a metric called the enhanced vegetation index, or EVI, which is sensitive to vegetation greening (a proxy of increasing leaf area and chlorophyll content). He then statistically modeled these greening patterns as a function of both the regional rainfall records and the Basin-wide flood extent dynamics maps that Dr. Mirela Tulbure, the Geospatial Analysis for Environmental Change Lab leader and paper co-author, had earlier developed using the same Landsat dataset.
“Landsat is the only satellite data archive that allows the quantification of vegetation and flooding dynamics across such a vast area with a level of spatial detail that water managers are happy to work with,” Tulbure shared.
Looking to the Future
Droughts are now considered the most severe natural hazard worldwide. Understanding regional drought impacts on vegetation equips water managers with the information they need to wisely allocate limited water resources.
In the Murray-Darling Basin, an areathat encompasses 14% of the Australian continent, a lot is riding on successful water allocation. Water managers want to allocate the contested surface water resources fairly and thanks to Broich and Tulbure’s research, Landsat is helping to inform their science-based policy solutions.
The methodologies developed by Broich and Tulbure can be translated to other semi-arid basins around the world that are facing similar water allocation struggles such as California’s Central Valley, the Colorado River basin, and the Iberian Peninsula.
After a month and a half of warmer-than-normal temperatures, summer finally turned to fall in Australia and Broich was on to the next phase of his research. He is now using Landsat together with the European Space Agency’s Copernicus Sentinel-2 data to create a higher temporal resolution dataset (utilizing the Harmonized Landsat Sentinel-2 data product). He is excited about the increased cadence that these joint observations allow because a denser dataset means even fewer flooding and greening events in the Basin will be missed.
Was Broich likewise excited about the extended summer? As one of those Australians with water perennially on his mind, he described it as: “nice, but also a bit concerning given the lack of rain.”
References
Broich, Mark, Mirela Tulbure, Jan Verbesselt, Qinchuan Xin, and Jack Wearne. 2018. “Quantifying Australia’s dryland vegetation response to flooding and drought at sub-continental scale.” Remote Sensing of Environment212.
Tulbure, Mirela, Mark Broich, Stephen V Stehman, and Anil Kommareddy. 2016 “Surface water extent dynamics from three decades of seasonally continuous Landsat time series at subcontinental scale in a semi-arid region.” Remote Sensing of Environment178.
Science feature written by Laura E.P. Rocchio, Landsat Communication and Public Outreach team


