
Presentation Title
Interactions Between Urban Vegetation and Surface Urban Heat Islands: A Case Study in the Boston Metropolitan Region
What are the major findings of this research?
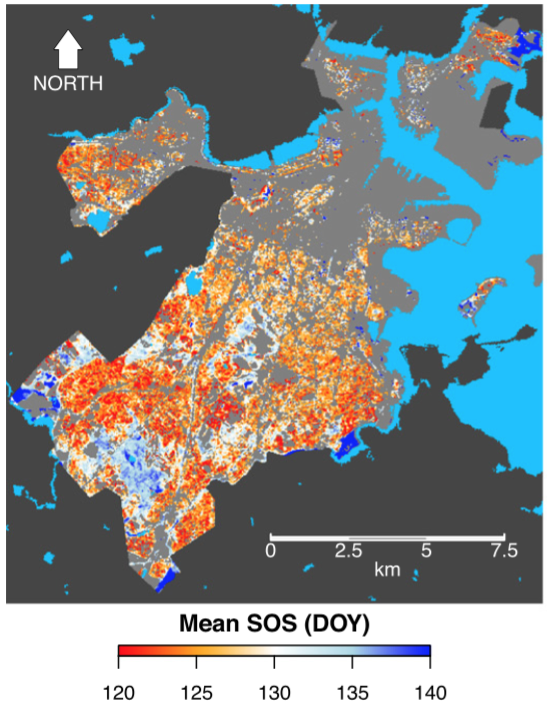
Results from this research show that a strong coupling exists between the surface urban heat island of Boston and the timing of spring leaf unfolding and autumn coloring of vegetation at both landscape and regional scales. On average, spring occurs 1.8 days earlier and autumn 2 days later for each 1 °C increase in mean growing season temperature. However, the spring phenology of urban woodland patches (largely consisting of native tree species) was less sensitive to urbanization.
What are the implications of your findings?
Urban heat islands serve as a sort of proxy for climate change and, therefore, provide insight as to how plants may behave under future warming. Our results indicate that the advancement of spring phenology of temperate deciduous forests may be less than what has been previously suggested by studies using satellite remote sensing data.
What insight did you gain from Landsat that would have been impossible to glean otherwise?
The improved spatial resolution of Landsat relative to traditional coarse resolution sensors such as MODIS and AVHRR helped provide a substantially refined characterization of interactions among urban vegetation cover, urban heat island intensity and vegetation phenology. In particular, Landsat allowed us to more carefully distinguish among patches of vegetation within the city with varying characteristics such as species composition and canopy density.
Can you describe how the presence of exotic tree species may affect the phenology/temperature relationship?
Previous research has demonstrated that exotic tree species (e.g., Norway maple) leaf out significantly earlier than native tree species in spring. Since surrounding rural areas are mainly composed of native species, it is important to accurately map native species within urban areas in order to appropriately assess the impact of elevated urban temperatures on phenology.
Co-authors:
David L Miller
University of California Santa Barbara
Jonathan Wang
Boston University
Mark A Friedl
Boston University
This work was made possible by funding from NASA, NSF and the NSF BIO REU Summer Program in Ecology at Harvard Forest.
Anyone can freely download Landsat data from the USGS EarthExplorer or LandsatLook.
Further Reading:
+ Landsat Abounds at #AGU16

A Rendezvous with Landsat
NASA outreach specialists led educators through a workshop on accessing and utilizing Landsat data at the annual Earth Educators’ Rendezvous.


