
First in a Series of Landsat 9 Ground Readiness Tests is Successful
Landsat 9 Ground System development team members executed the first of a series of Ground Readiness Tests this week.
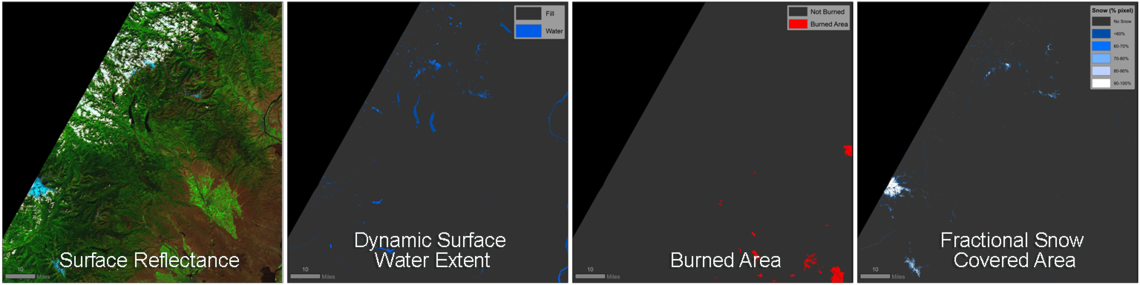
New Landsat Level-3 Products Released
The USGS has developed research-quality, applications-ready, Landsat Level-3 Science Products that are now available for download from EarthExplorer.
How You Can Help Make a Better World Land Map
Using the technology inside your phone, you can help scientists classify land cover and track changes.
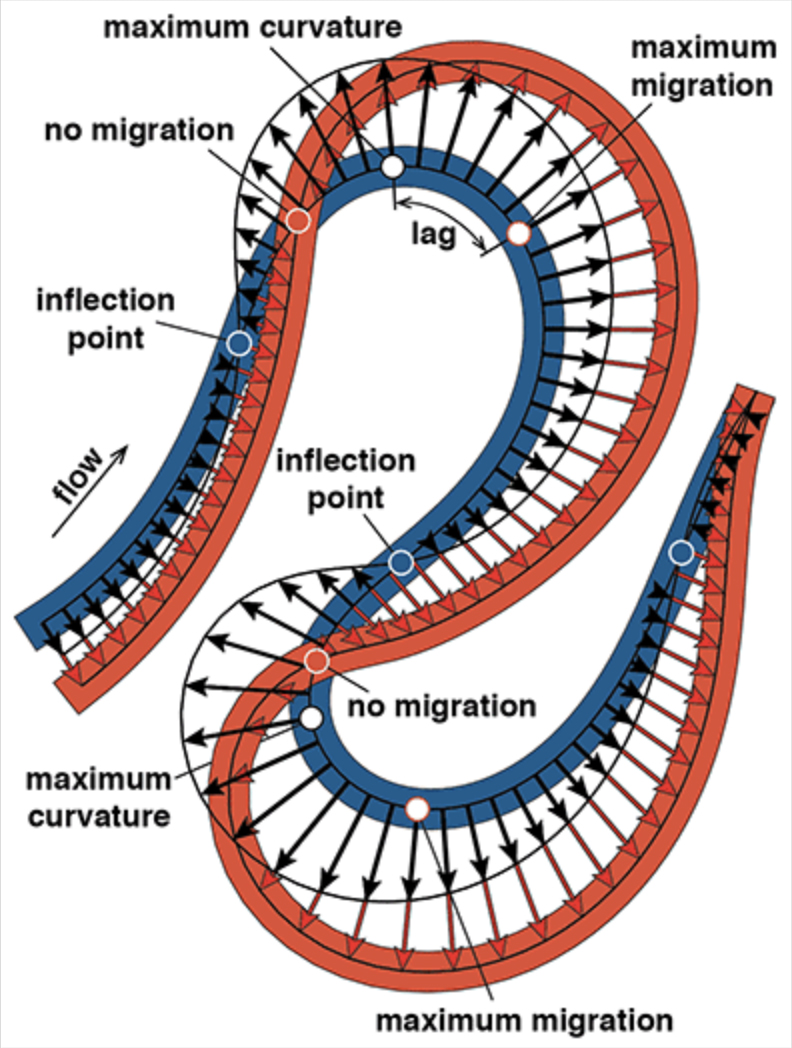
Sharp Bends Make Rivers Meander, As Landsat Attests
Turns out, the rate of river migration is directly linked to how sharp its bends are.
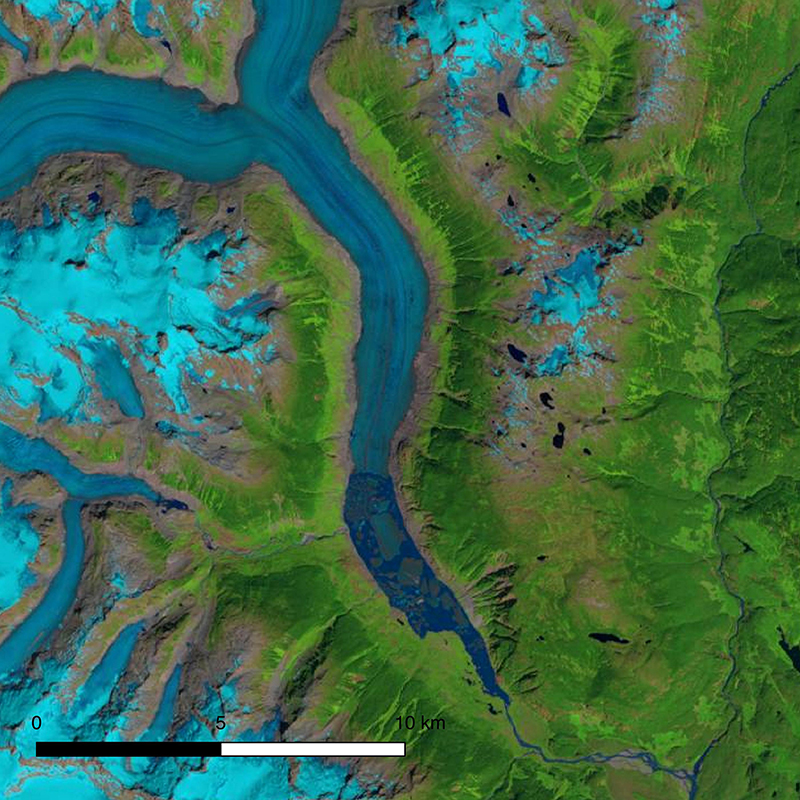
New Research Shows Significant Decline of Glaciers in Western North America
The first comprehensive assessment of glacier mass loss for all regions in western North America (excluding Alaskan glaciers) suggests that ice masses throughout western North America are in significant decline.
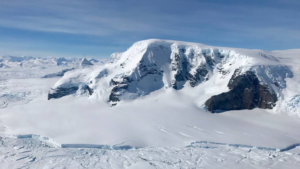
Antarctica Losing Six Times More Ice Mass Annually Now Than 40 Years Ago
Antarctica experienced a sixfold increase in yearly ice mass loss between 1979 and 2017.
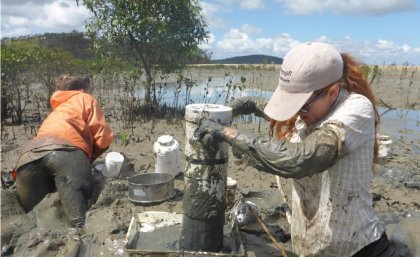
Loss of Intertidal Ecosystem Exposes Coastal Communities
The study used machine-learning to analyze more than 700,000 Landsat images to map changing global distribution of intertidal areas over a 30-year period.
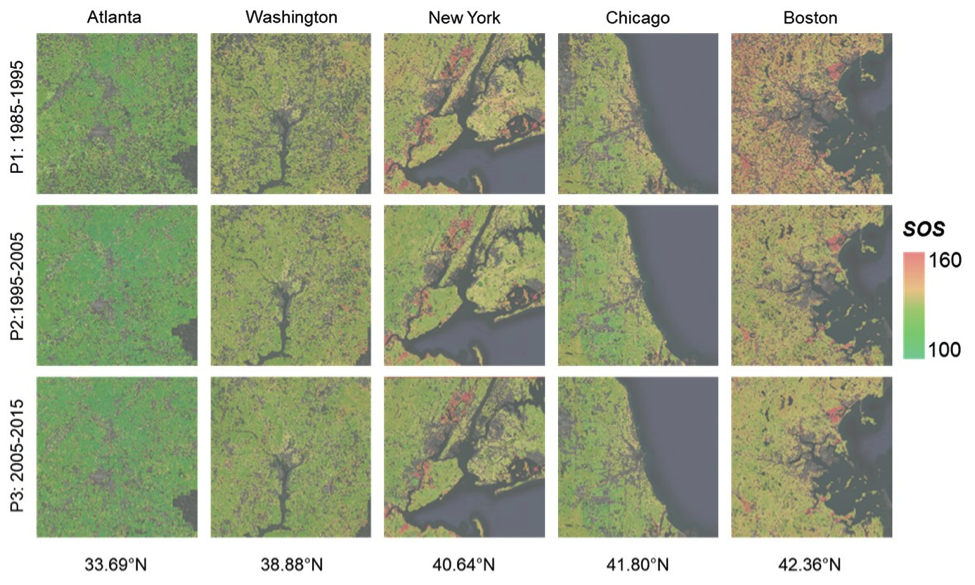
As Cities Grow, So Does the Urban Growing Season
New insights on how vegetation phenology in urban and surrounding areas respond to urbanization.
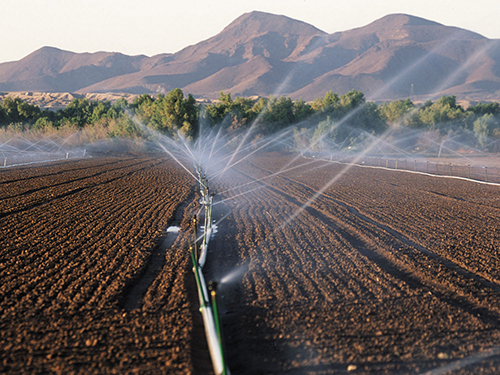
Mapping Water Use Nationwide With Landsat
USGS EROS scientists are leveraging the capability and history of Landsat along with weather data to map landscape-wide water consumption.
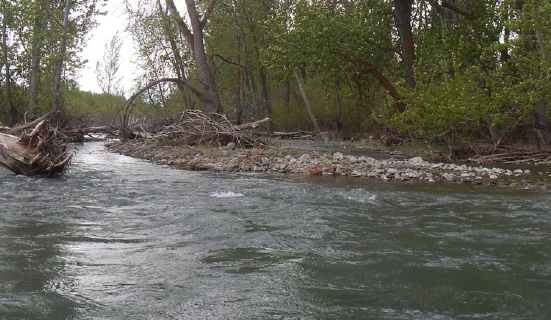
How Landsat Helps Alert Communities to Local Flood Hazards
For larger rivers, Landsat provides a rich dataset to define spatiotemporal patterns of channel shifting.
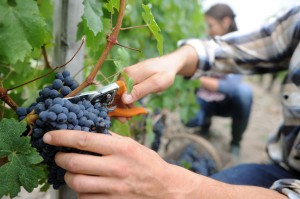
Landsat Thermal Data Provides Insight to Vintners
Landsat thermal bands allow for the measurement of water use and moisture status at the management scale.
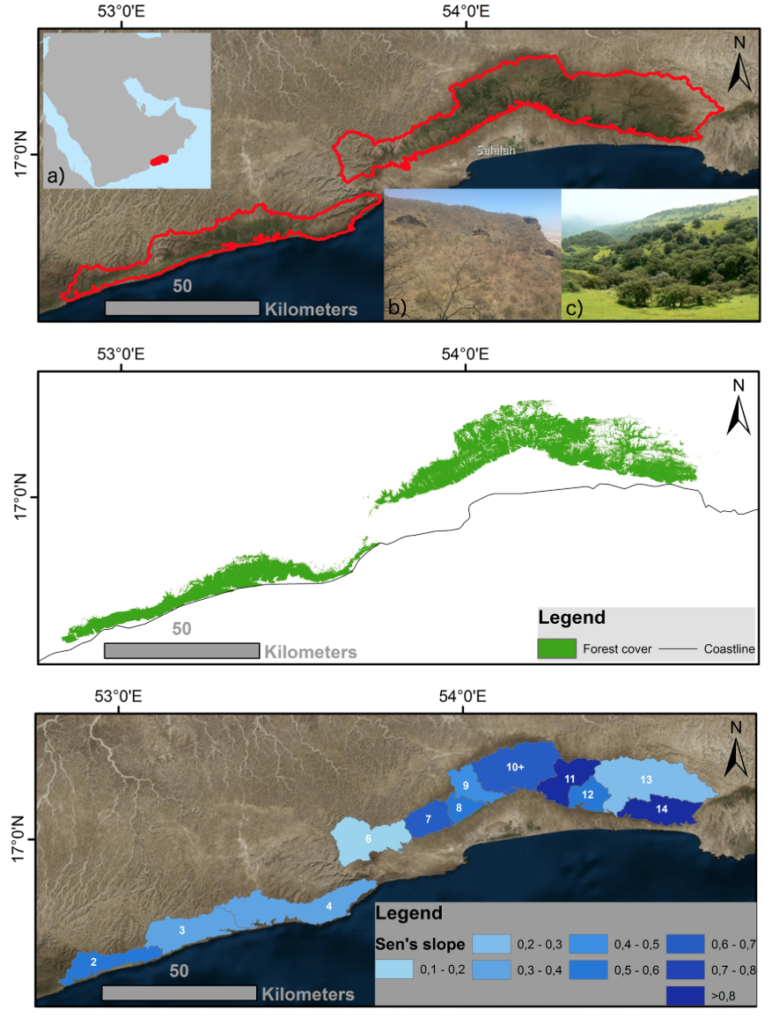
Getting to Know the Dhofar Cloud Forest
Learn more about this rather unusual seasonal and semi-arid cloud forest.
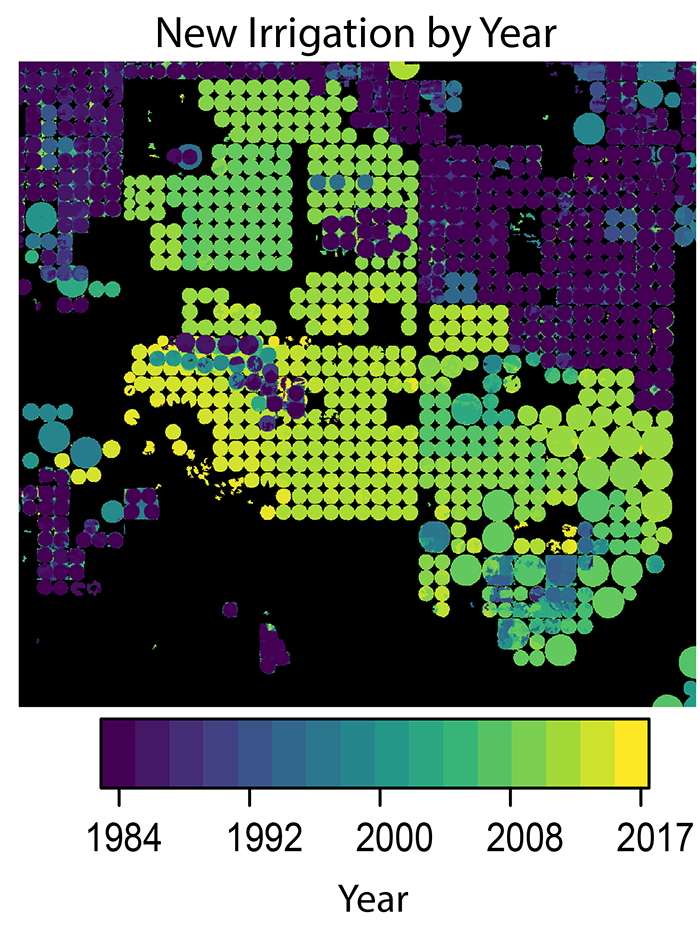
The Shifting Irrigation Patterns of the U.S. High Plains Aquifer
A new method to use the full Landsat archive to produce annual maps of irrigated area over the High Plains Aquifer in the central United States.
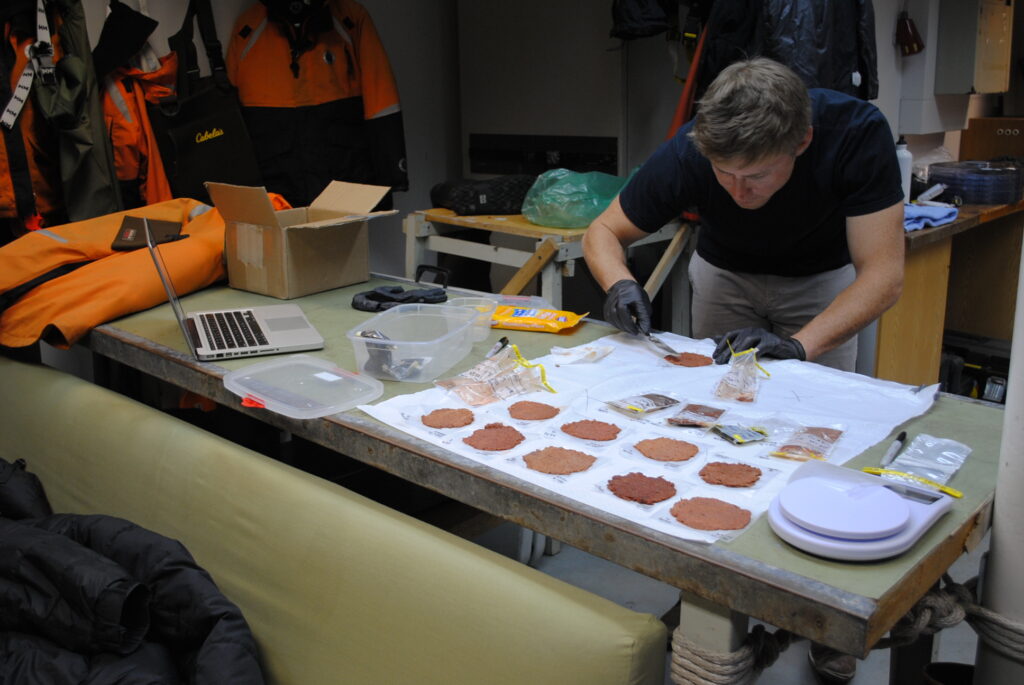
Determining Penguin Diet with Landsat (and Piles of Poo)
Scientists are now able to determine what penguins are eating from space.

Retrieving Secchi Depth with Landsat 8
Landsat 8 allows for the acquisition of spectral data for monitoring water quality from lakes and drinking water reservoirs across the United States.
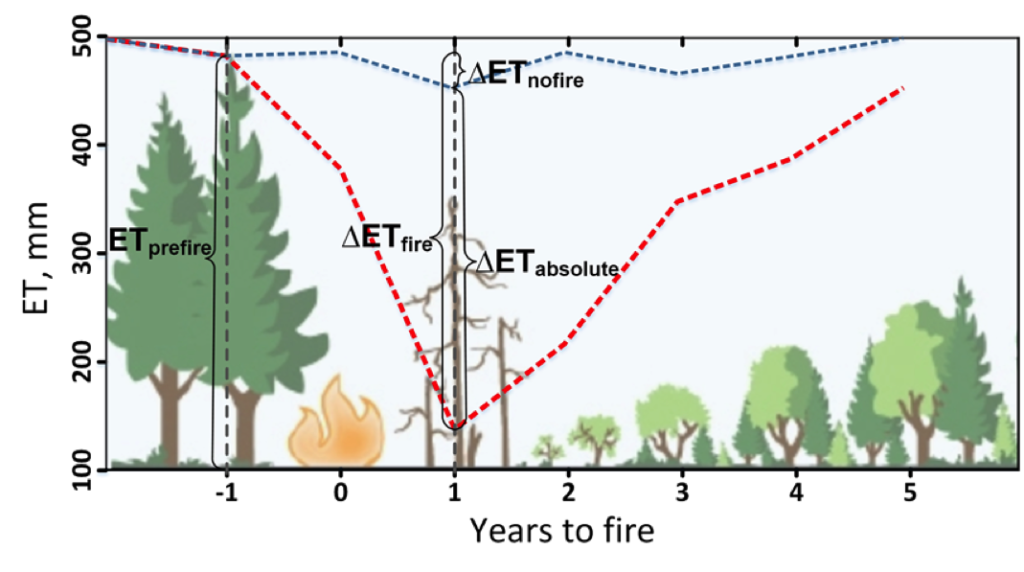
Understanding How Fire Alters the Water Use of Sierra Nevada Forests
Fires play an important role in regulating forest density, vegetation water use, and runoff.
Mapping Water Use Nationwide With Landsat
USGS EROS scientists are leveraging the capability and history of Landsat along with weather data to map landscape-wide water consumption.
How Landsat Helps Alert Communities to Local Flood Hazards
For larger rivers, Landsat provides a rich dataset to define spatiotemporal patterns of channel shifting.
Landsat Thermal Data Provides Insight to Vintners
Landsat thermal bands allow for the measurement of water use and moisture status at the management scale.
Getting to Know the Dhofar Cloud Forest
Learn more about this rather unusual seasonal and semi-arid cloud forest.
The Shifting Irrigation Patterns of the U.S. High Plains Aquifer
A new method to use the full Landsat archive to produce annual maps of irrigated area over the High Plains Aquifer in the central United States.
Determining Penguin Diet with Landsat (and Piles of Poo)
Scientists are now able to determine what penguins are eating from space.
Retrieving Secchi Depth with Landsat 8
Landsat 8 allows for the acquisition of spectral data for monitoring water quality from lakes and drinking water reservoirs across the United States.
Understanding How Fire Alters the Water Use of Sierra Nevada Forests
Fires play an important role in regulating forest density, vegetation water use, and runoff.
