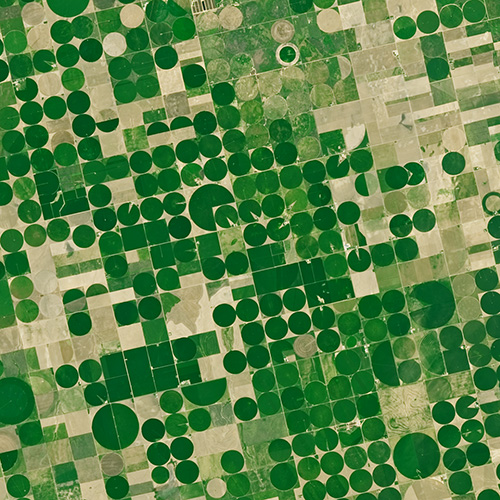
Agriculture: The View From Space
The Food and Agricultural Organization of the United Nations published an audio article about using geospatial data, including Landsat, to monitor would agriculture on soundcloud.

The Food and Agricultural Organization of the United Nations published an audio article about using geospatial data, including Landsat, to monitor would agriculture on soundcloud.

USDA researcher Martha Anderson uses satellites and instruments like Landsat and ECOSTRESS to see how stressed plants are from space.
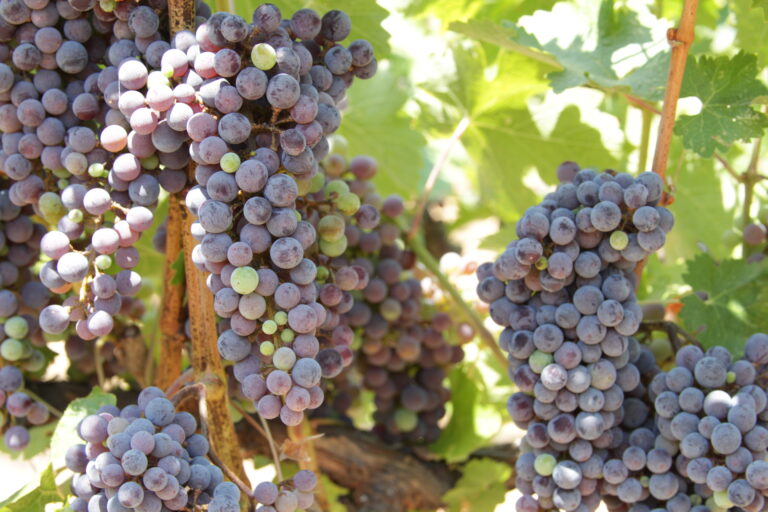
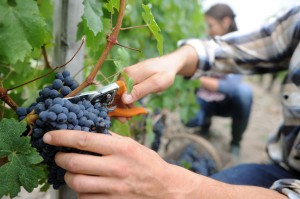
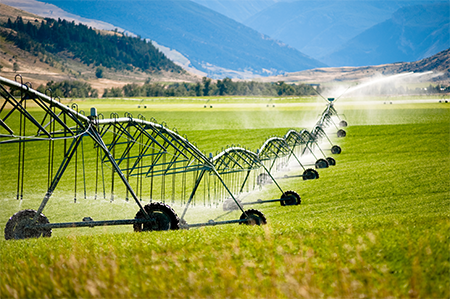
Grape growers like Gallo are using data from Earth-observing satellites to better track soil and vine moisture levels, understand vine water use and plan grapevine irrigation.

A new satellite-driven biophysical model can make accurate forecasts of crop water use that are critical for farmland water management and sustainability.
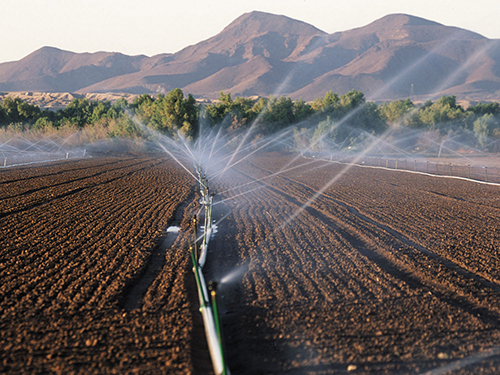
With Landsat data, farmers can find new ways to grow more crops with less water.
IndigoAg is using HLS data to help fulfill its mission of making farms more profitable and sustainable.
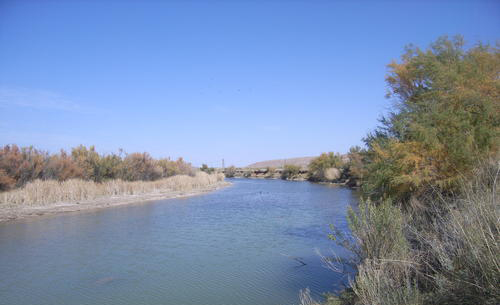
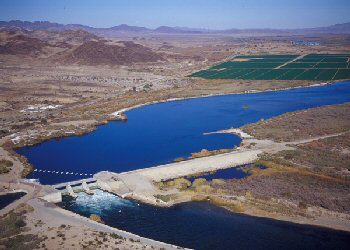
New Mexico is one of the most arid states in the US, and precise and accurate information on water use is of utmost importance.
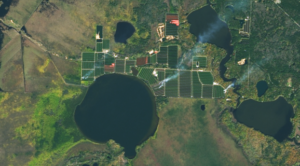
Remote sensing can aid the monitoring and evaluation of incentivized farming programs like the one in Maryland.
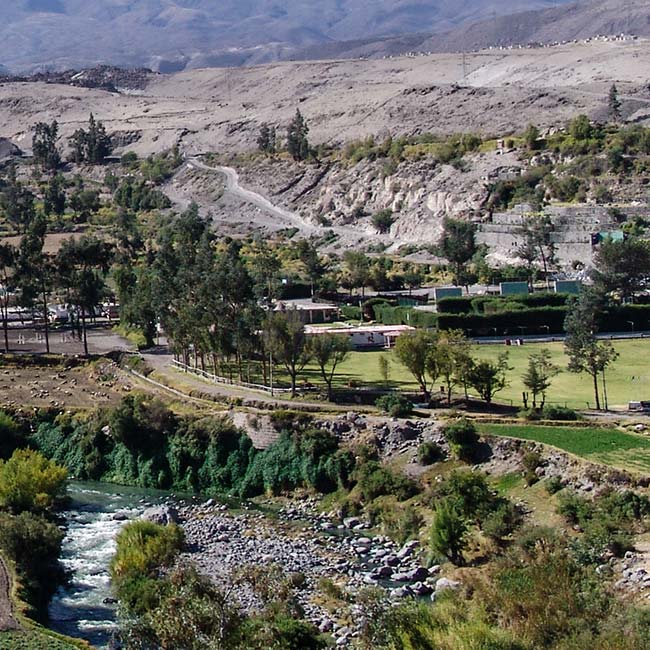
Landsat has helped map the expansion of intensive agriculture in arid Arequipa, Peru.
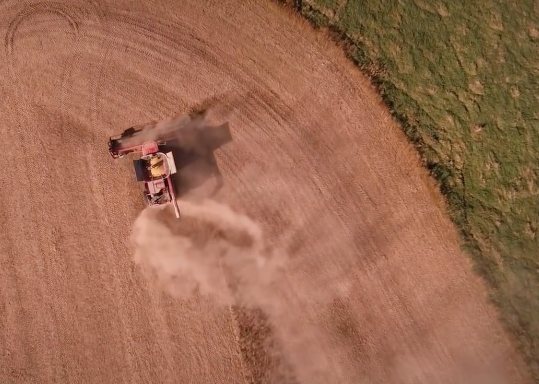
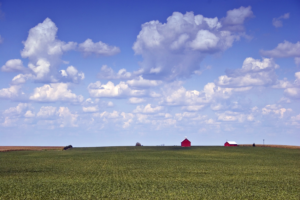
Farmers across the Midwest are in a race to finish harvesting their corn, soybean, and other staples of the Thanksgiving dinner table before the first crop killing freeze sets in.
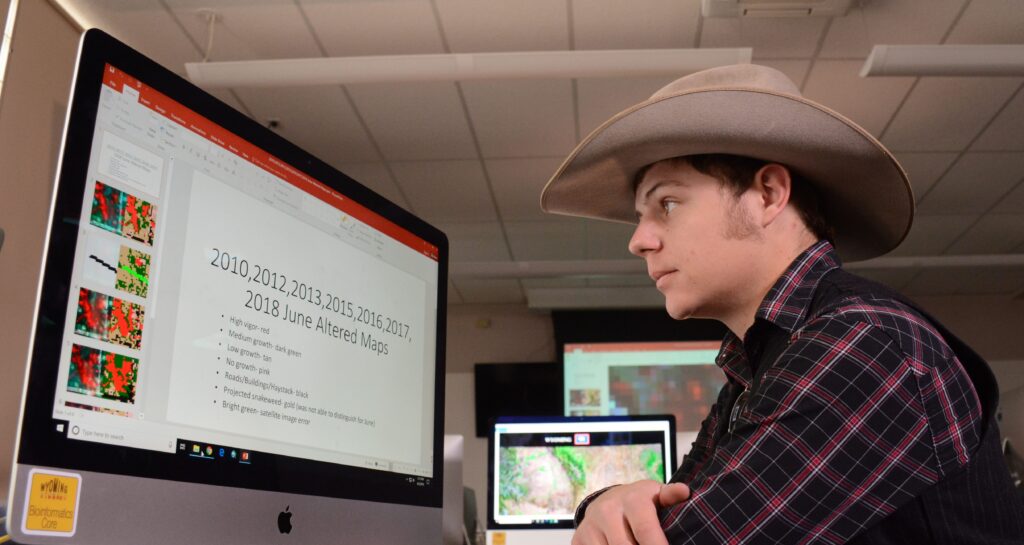
Wyoming students in the College of Agriculture and Natural Resources are using Landsat images to gauge and improve lands owned by their families.
It started as an algorithm to detect clouds in satellite imagery, but now the software is being used for everything from increasing food security in the developing world to guiding futures trading on Wall Street.
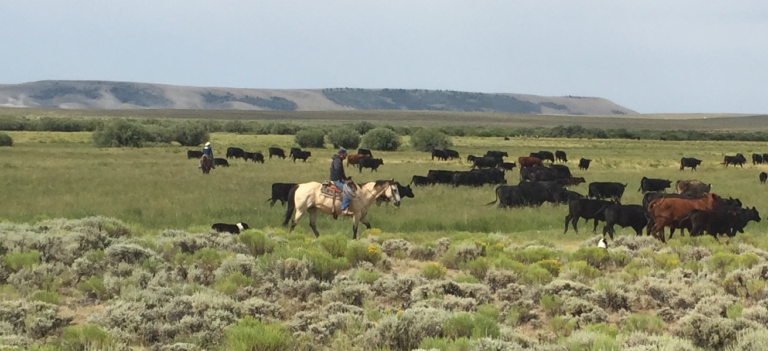
The Landsat-based Rangeland Analysis Platform and Green-Cast are valuable tools for ranchers adaptively managing their land.
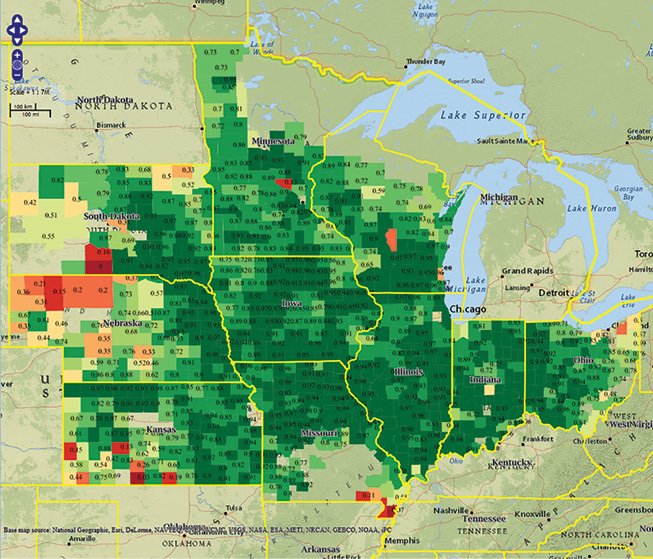
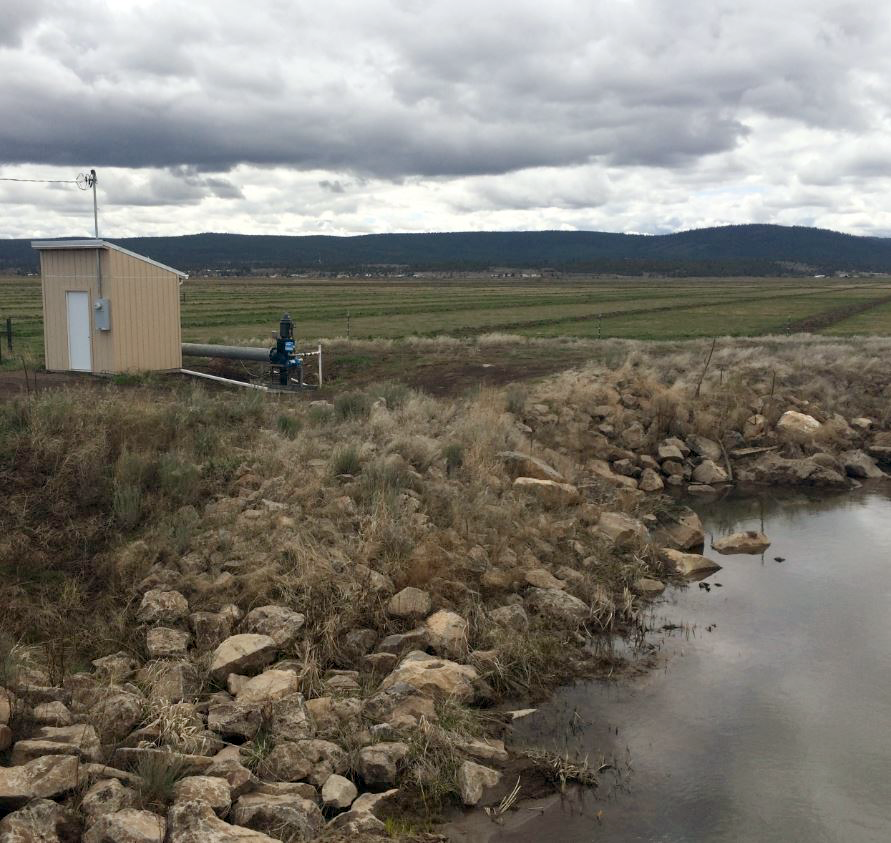
USGS EROS scientists are leveraging the capability and history of Landsat along with weather data to map landscape-wide water consumption.
Landsat thermal bands allow for the measurement of water use and moisture status at the management scale.
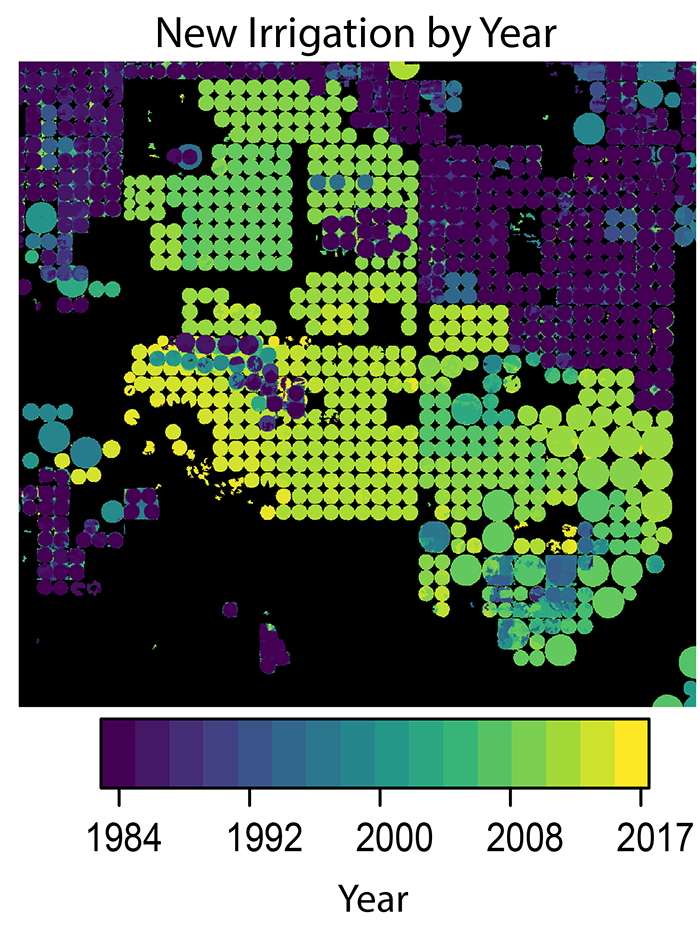
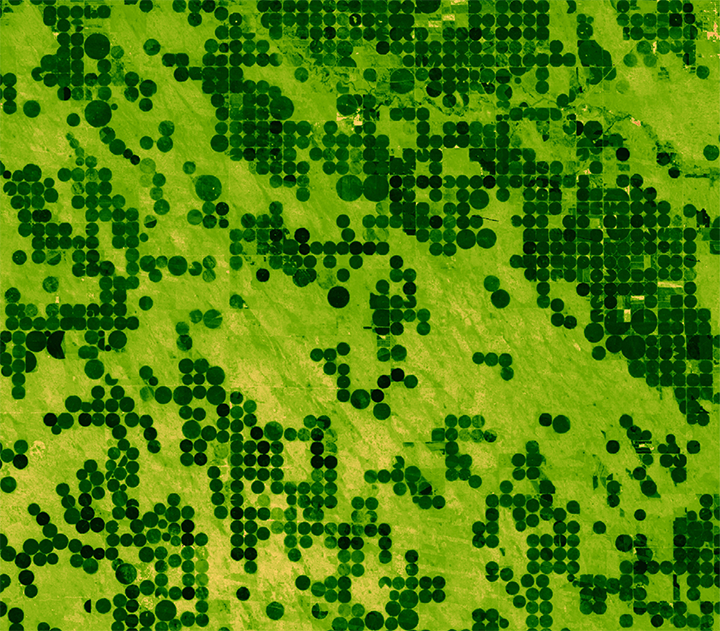
A new method to use the full Landsat archive to produce annual maps of irrigated area over the High Plains Aquifer in the central United States.
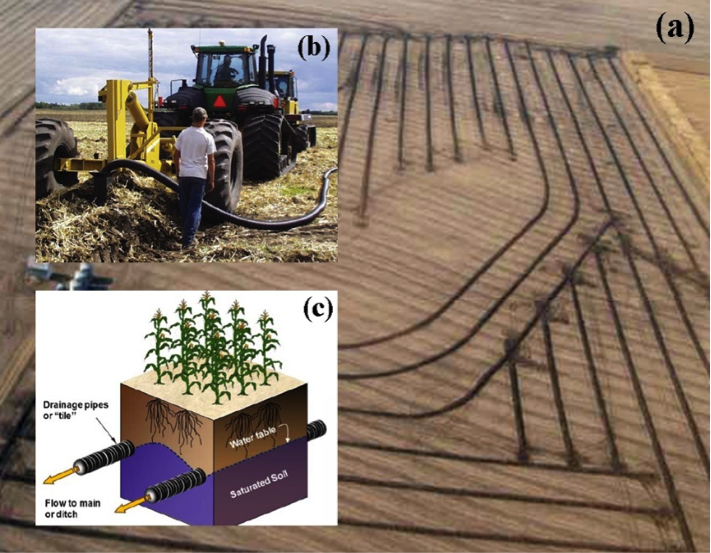
Making annual high-resolution agricultural subsurface drainage maps for the Northern Great Plains regions using multiple satellite and model datasets with Google Earth Engine.
A robust detection method to track crop cover dynamics and identify the planting year through Landsat time series data.
Boston-based startup TellusLabs uses Landsat and MODIS images to predict corn and soy yields with remarkable accuracy.
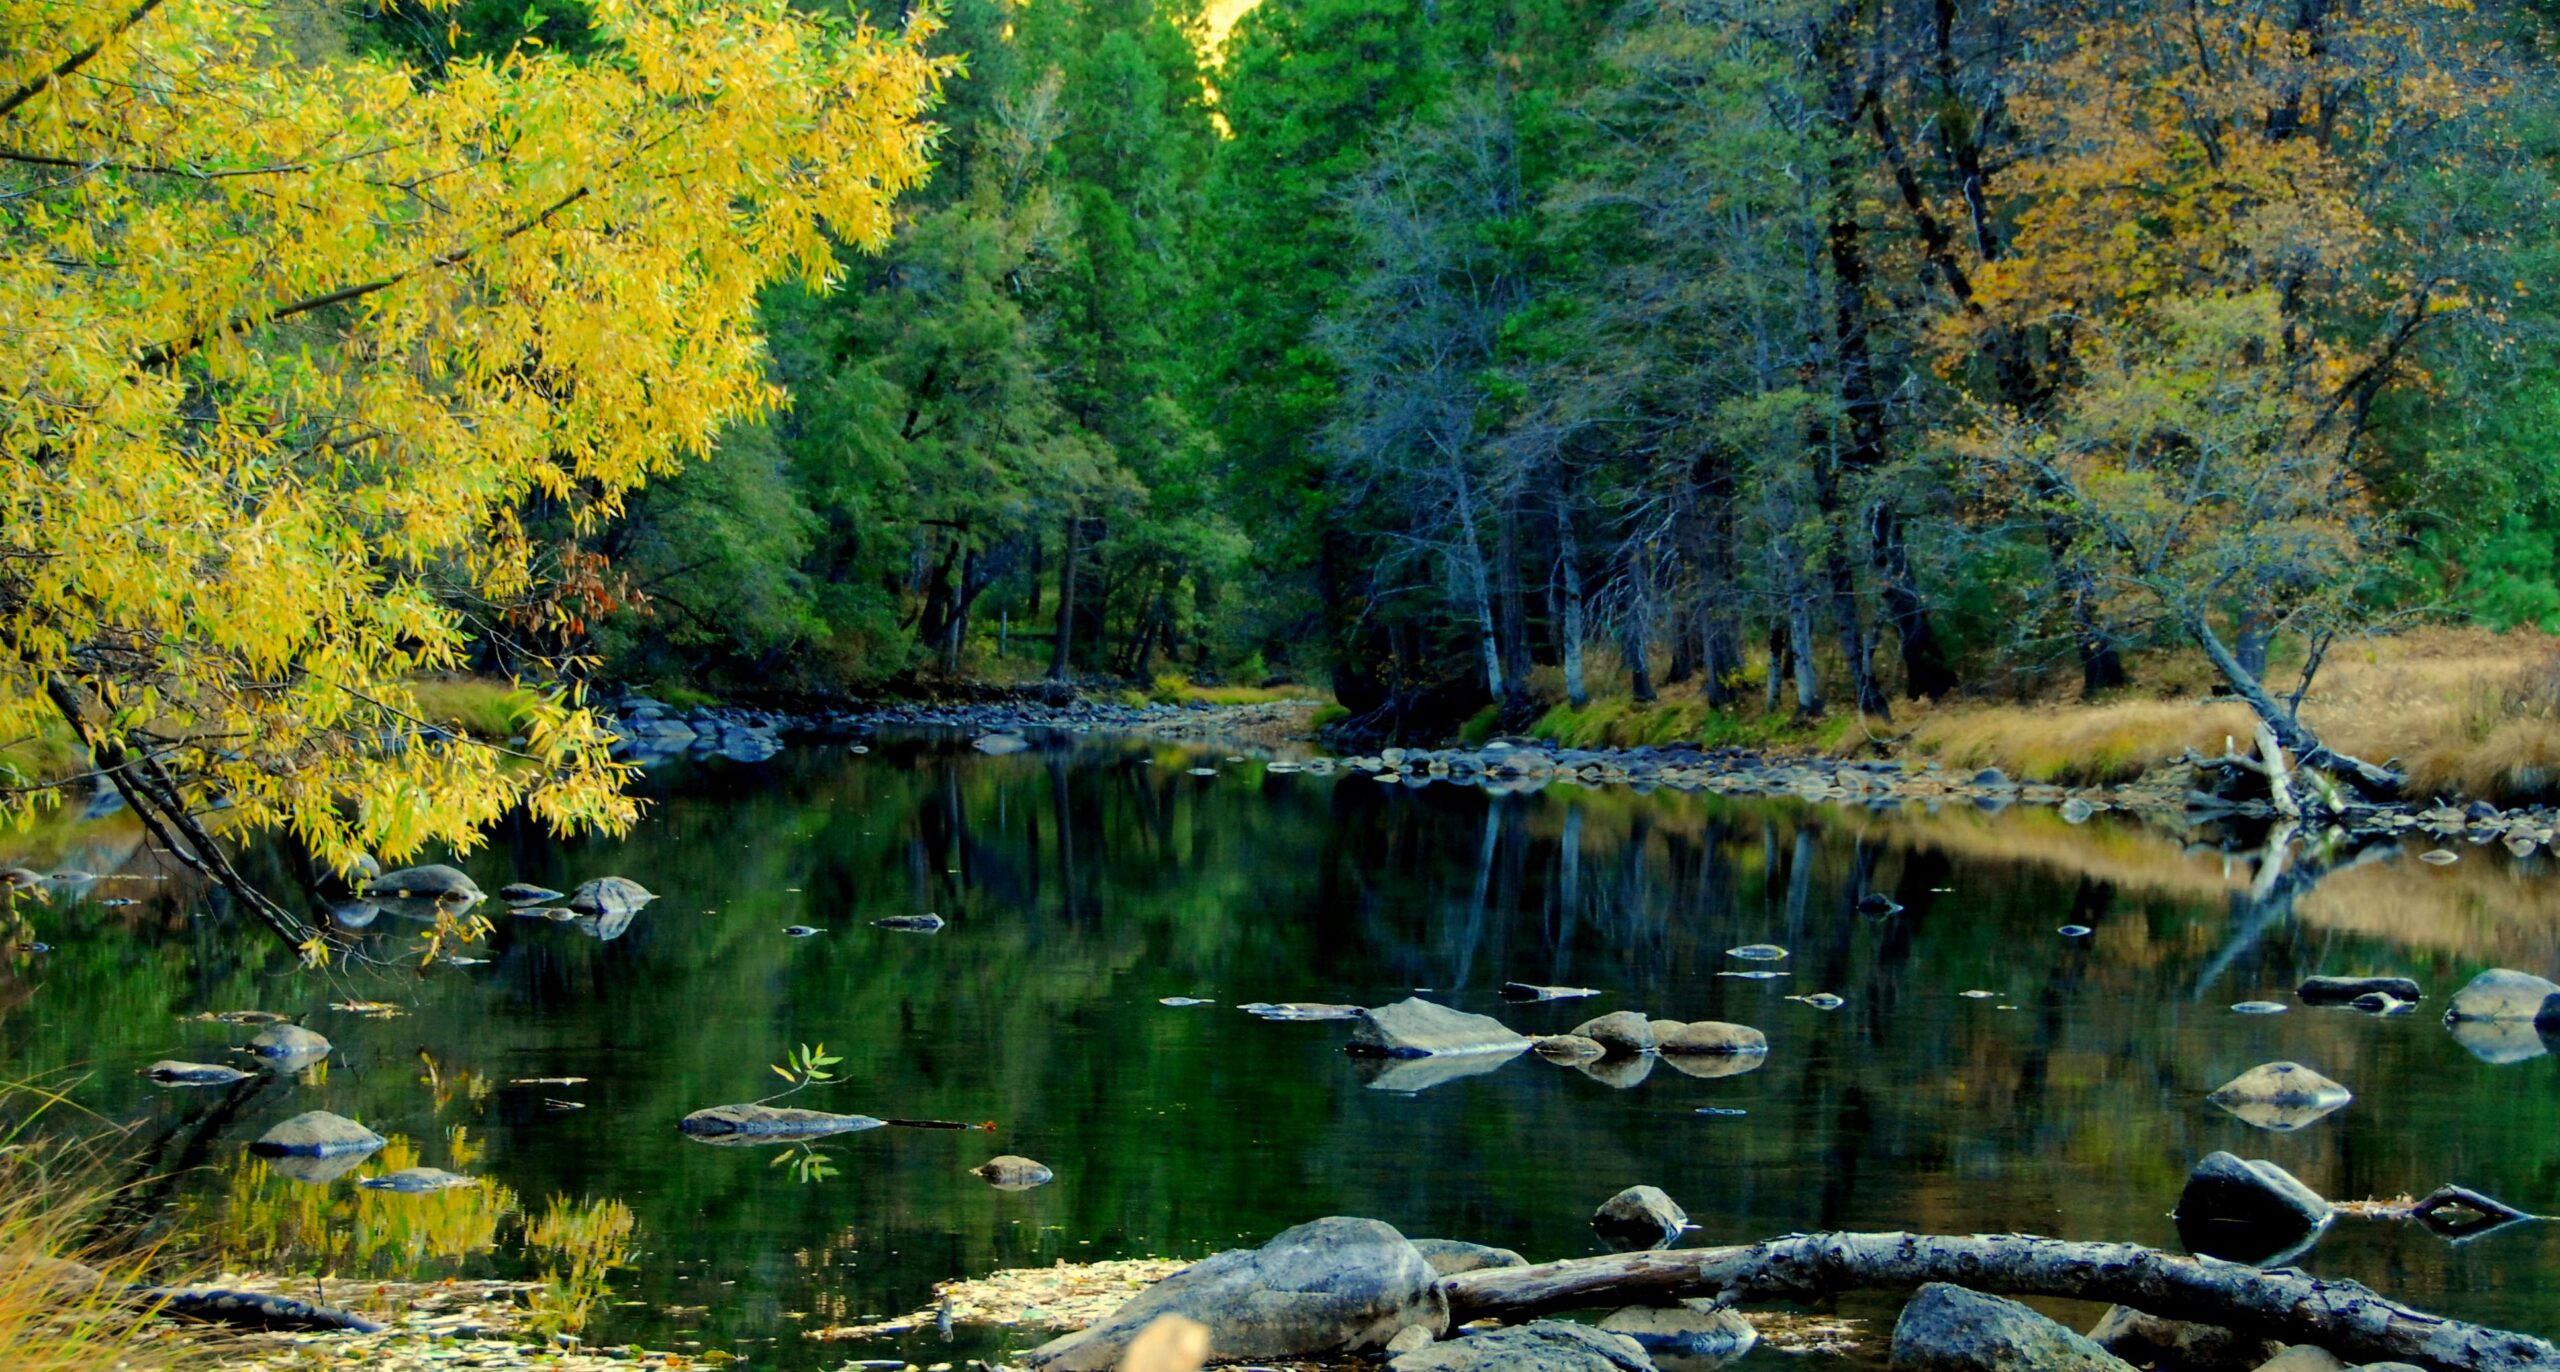
When it comes to water, when does less really mean more?
Researchers armed with data from the Landsat Earth-observing satellites recently teamed up with Google to track water used for irrigation.
Patrick Hostert from the University of Berlin discusses the value of Landsat’s long archive to studying phenology.
Scientists have proven a new technique for distinguishing the corn and soybean crops using satellite data and the processing power of supercomputers.
Martha Anderson talks about the value of Landsat and its thermal data for understanding agricultural lands.

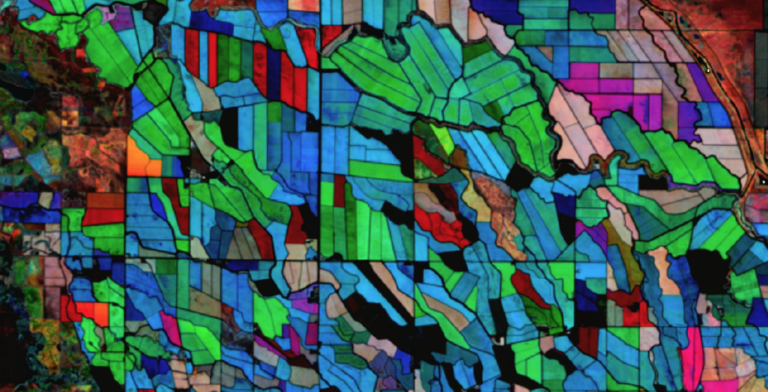
A new program uses Landsat satellite data to automatically categorize what’s on the ground more accurately than other land cover products.
Thirty-one years of observed water use trends in the Southwestern U.S.
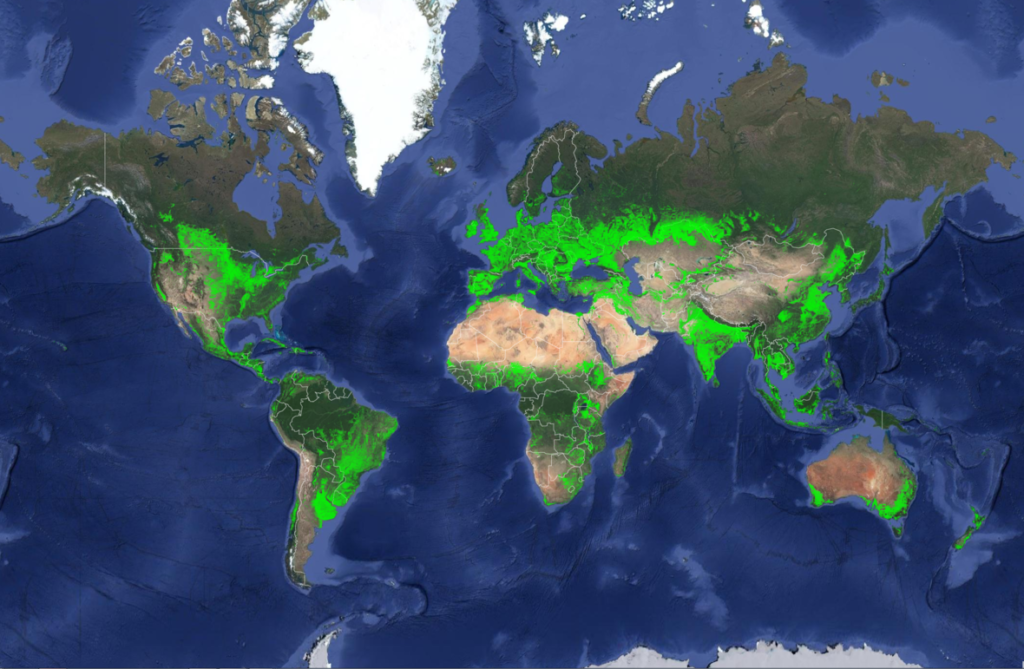
A new map was released today detailing croplands worldwide in the highest resolution yet.
Researchers detail their use of satellite images to produce annual maps of irrigation.
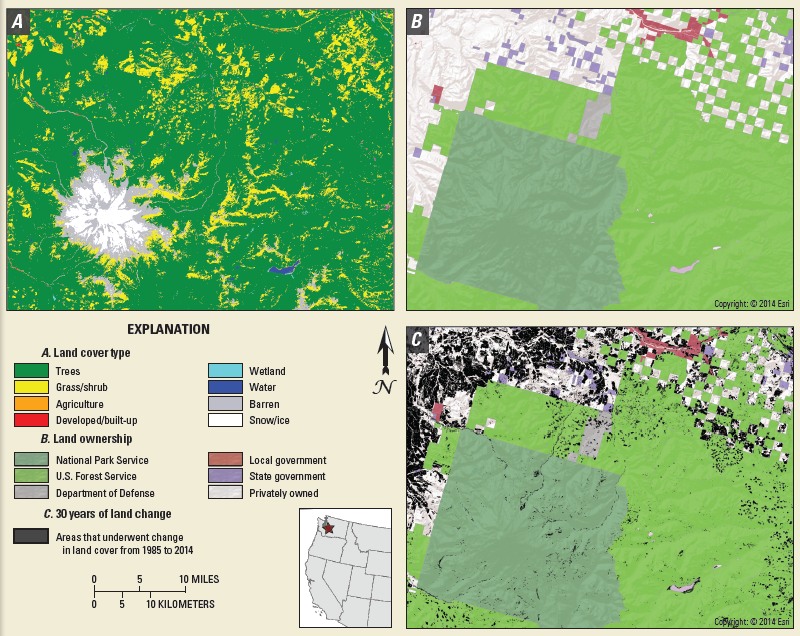
A new initiative called Land Change Monitoring, Assessment, and Projection provides definitive, timely information on how, why, and where the planet is changing.
A team of economists from the USGS Fort Collins Science Center has published a new report on Landsat imagery use in agriculture.
Using Landsat to map croplands over the U.S. High Plains Aquifer.
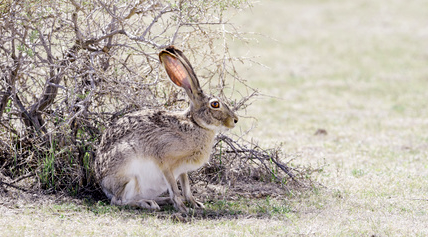
An approach for evaluating brush management conservation.
Water use trends observed in the Southwestern U.S. over three decades.
