

Ecologists and economists alike know that we all rely on the resources of the natural world to survive—a world both finite and interconnected.
In 1968, Apollo 8 astronaut Bill Anders’ “Earthrise” photo transformed the way Earth’s inhabitants viewed the planet. The concept of Earth as a vast place with regions unknown was turned on its head; we realized that Earth was a tiny island of life in the vast vacuum of space.
Earlier NASA photographs of Earth from the Mercury and Gemini missions inspired then-director of the U.S. Geological Survey, William Pecora, to champion a satellite-based remote sensing program to monitor the natural resources of Earth—a vision that was realized with the July 23, 1972 launch of the Landsat 1 satellite (originally named the Earth Resources Technology Satellite-1, or ERTS-1).
After Landsat 1’s launch, the NASA Administrator, James Fletcher, wrote “The ERTS-1 satellite, launched just eight months ago, is certainly a major step forward in an attempt to decide what we can do to provide the data that are necessary to improve the quality of life here on Earth.”
Continuous measurements of Earth’s land surface by Landsat 1 and its successor satellites have documented planetary change for 50 years now. Patterns, cycles, and trends of our natural and built environment have been revealed by the five decades of data provided by Landsat. The Landsat Program is a joint partnership of NASA and USGS—NASA builds and launches the satellites; USGS helps define the measurements needed for science, operates the satellites once they are in orbit, and maintains the data archive.
Today, we are in what has been called a golden era for Earth observations. The undeniable value of a space-based planetary perspective has led to a growing suite of regularly collected data about our planet from space. When used together these various satellite measurements give us a stronger understanding of our changing home planet and create a robust decision support system.
While no sensor is an island, Landsat adds unparalleled longevity to the record of Earth’s land surface. Because Landsat provides freely available, comparable, objective data, many have likened Landsat to a “time-machine” for looking back at planetary change. Like time-honored indigenous wisdom of place, Landsat gives us knowledge of ecosystem history for the entire planet over the past five decades.
As we strive to meet sustainable development goals and balance competing needs for Earth’s finite resources, the Landsat data record has only grown in importance. Landsat has become woven into the fabric of our planetary understanding.
Let’s explore some of the ways that Landsat has helped us map, measure, and manage the resources of our only home.


Forests, the so-called “lungs of the planet,” give us oxygen, store climate-warming carbon, prevent soil erosion, provide shade and cool urban areas, improve water quality, and provide habitat. Likewise, wetlands, including salt marshes and mangrove forests, are regarded as “Earth’s kidneys.” They filter water, protect against floods—the natural disaster that impacts the most people—and support the many plants and animals that form the base of the food chain feeding creatures up the food chain including us.
Before the satellite age, globally consistent forest and land cover inventories didn’t exist. Even in countries with forestry expertise, management resources, and tested surveying methodologies, the advent of repeatable satellite-based data from Landsat was readily welcomed.
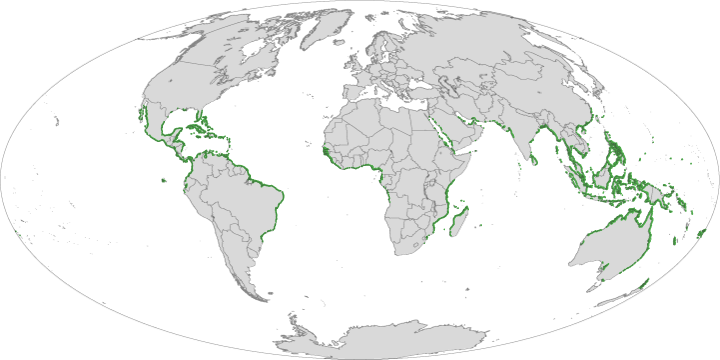
It was Landsat data that showed the first credible, and verifiable rates of deforestation in the Amazon. Landsat also was behind the first definitive map of global mangroves and mangrove habitat change.
Today, land management agencies around the world rely on satellite imagery from Landsat. Renown agencies like the U.S. and Canadian Forest Services regularly use satellite data including Landsat to monitor forests and plan for impacts of climate change. The long-term, well-calibrated, “science-grade” spectral measurements from Landsat satellites enable not only the measuring of abrupt forest changes like fire and deforestation, but also subtle changes like that of mountain pine and spruce beetle infestations, to enable intervention before widespread forest die-off.
Landsat has shown us that wetlands worldwide are in decline largely at the hand of human development and climate change. Understanding these changes is a first step for planning wetland conservation and Landsat-based wetland health evaluations are supporting restoration efforts.
Nicholas Murray, the head of James Cook University’s Global Ecology Lab, recently said in a University of Cambridge press release that, “Global-scale monitoring is now essential if we are going to manage changes in coastal environments effectively.”
A number of biome shifts have recently been documented by Landsat including boreal forest shifts and the increase of white-sand savannas in the Amazon. Satellite-based monitoring and mapping of ecosystems are a key ingredient for the safeguarding of habitats and biodiversity protection.
As Landsat has shown us, our planet has remarkable potential for recovery. Perhaps nothing illustrates this more vividly than the once old-growth forest covered Mount St. Helens turning into a post-eruption “moonscape” and over the next four decades becoming once again blanketed by forests.

Landsat not only helps agricultural managers monitor crop production, it has also recorded land use shifts to and from agriculture. Conversion of forested lands to commodity and small-scale farms has been especially pronounced in the tropics during the fifty years of Landsat’s watch.
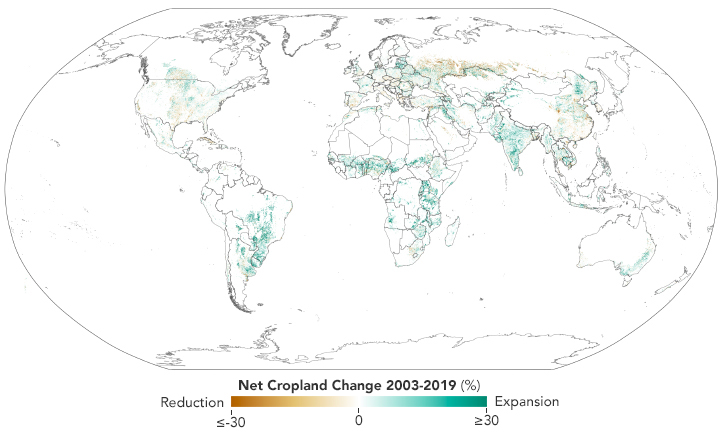
A team of researchers recently used Landsat data to map global cropland changes during the 21st century. Landsat showed that cropland increased by 9 percent, but production was increased by 25 percent due to intensified agricultural land use; information that provides vital insights for global efforts to produce food sustainably.
Producing greater quantities of food as population expands and climate change strains water supplies is a major challenge, and satellites, including Landsat, have outsize rolls to play in data-driven management decisions.
One of the first operational applications of satellite remote sensing was in the field of agriculture. Following the launch of Landsat 1 and its Multispectral Scanner System (MSS) in 1972, large-scale agricultural experiments were designed to test real-time space-based crop inventories and later to forecast commodity crop yields.
These studies established very early on that information provided by Landsat about crop health and growth could immensely improve forecasts of global food supply and aid food stability.

Having data on how people and climate change are altering surface water resources is essential for dealing with water scarcity. For the first time in 2016, scientists from the European Commission’s Joint Research Center used over three million Landsat satellite images to map the planet’s surface water every year from 1984 forward, giving water managers information about the movement of Earth’s surface water.
In terms of water use, agriculture accounts for the most water use worldwide. Landsat data provides information, in particularly, thermal infrared measurements (taken by Landsat satellites since 1982) that are used for widespread satellite-based water consumption measurement tools by government agencies and farmers alike.
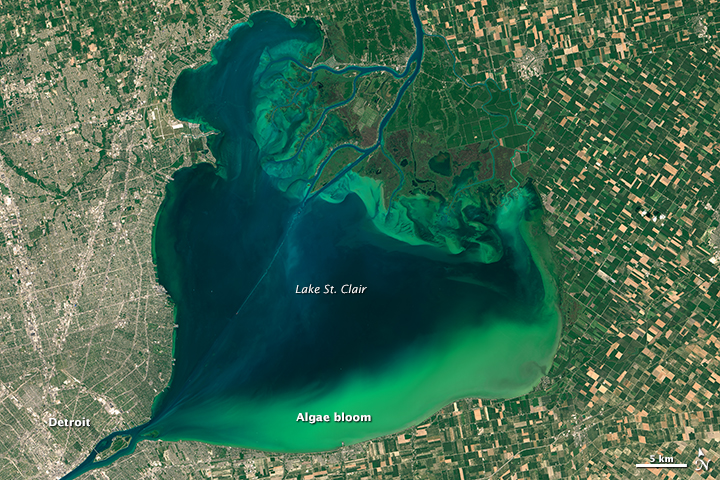
Landsat data is also regularly used for accessing water quality of surface and near-shore waters; helping water managers protect people from toxic algae blooms. This type of information, amassed over decades, also gives context for changes happening over time. A recent Landsat-based study of more than 14,000 U.S. Lakes showed that water clarity (and quality) has been improving since 1984, a change the authors correlate with U.S. environmental reforms of the 1970s and 80s.
In other watery expanses of our planet, Landsat has had a long history of helping to identify new islands, and uncharted coral reefs. In the early 2000s, the most detailed global map of coral reefs since Darwin was created with Landsat data. Likewise, Landsat is regularly used to map kelp forests around the world.
Landsat provided data that used to map and measure its coastline, glaciers, and icesheets, finding uncharted mountains at the head of Lambert Glacier, previously unknown rock outcrops, and meteorite-strewn blue ice.
A Landsat 7-based mosaic of Antarctica provided the most detailed imagery of the continent ever available for the 2007-2008 International Polar Year.
In the late 1970s, USGS glaciologist, Ritchie Williams, used Landsat to provide the first global survey of Earth’s glaciers using Landsats 1, 2, and 3. Landsat has been used to regularly map glaciers ever since, with a recent studyof 14,000 glaciers showing accelerated loss, fragmentation, and disappearance of glaciers worldwide. Using Landsat data, the GoLIVE project provides ice velocity measurements of glacier movement across the globe.
Over the last half century, Landsat has witnessed dramatic warming in mountains regions. From the European Alps to the Chilean Andes, snow cover has been diminishing and vegetation above the tree line expanding. Climate change—the greatest environmental challenge of our time—is the culprit.
Informed by planetary sages like Landsat, decision-makers have the vital signs of our planet—information needed to make life-sustaining decisions for our species.
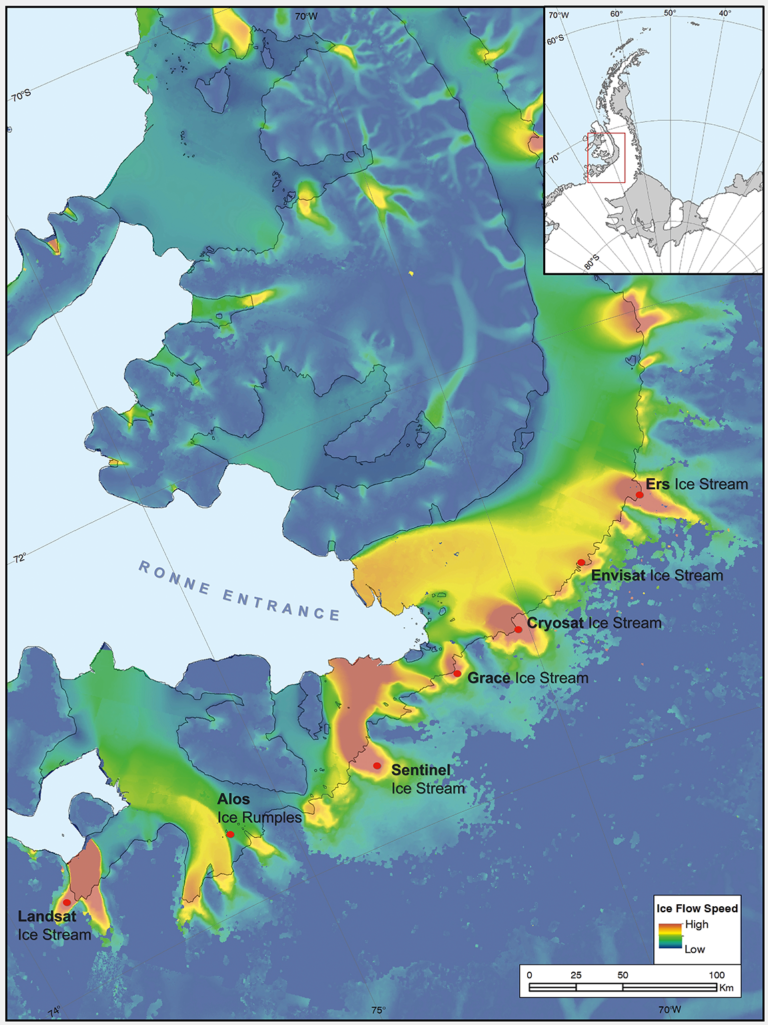
As the days march on, Landsat satellites continue to collect data about our planet, adding to an invaluable fifty-year data record; and for now, in remote western Antarctica, the Landsat Ice Stream—named for one of the greatest satellite Earth explorers of our time—flows quietly into the Stange Ice Shelf.


