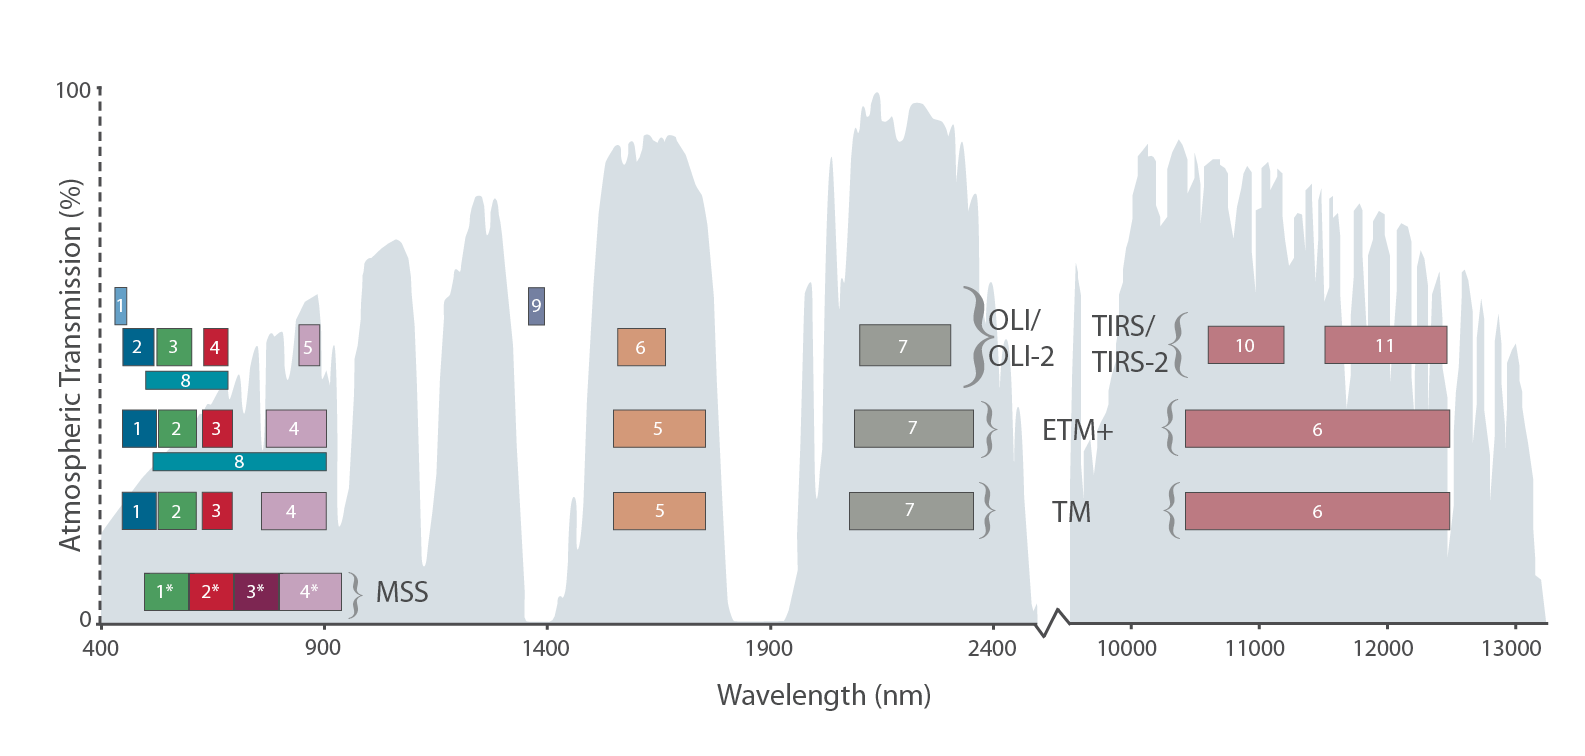
In the nearly five decades since Landsat 1 launched, the spectral bands of the Landsat satellites have evolved. Landsat 9 has the most evolved of the Landsat spectral bands.
In 1972, Landsat 1 launched with a three-band Return Beam Vidicon camera system and a secondary four-band digital Multispectral Scanner System (MSS). The MSS with its scanning mirror whisking back and forth to create an image, seemed to many researchers of the period the antithesis of the high quality camera systems traditionally used in aerial studies. But the secondary MSS instrument proved itself the imaging powerhouse producing superior data. But the four-band MSS was spectrally coarse; it essentially mimicked the color infrared films that became widely used during WWII.
For follow-on sensors, Landsat management brought together scientists from diverse fields to discuss and recommend spectral channels most useful for answering questions in their research areas. These discussions informed the more sophisticated Thematic Mapper (TM) sensor with its seven spectral bands that flew on Landsats 4 and 5. The Landsat TM band placement has subsequently guided all successive Landsat sensors and is is also echoed in almost all modern passive remote sensing systems—domestic, international, public, commercial, and even those circling about other planets.
Today, Landsat 8 and Landsat 9 have eleven spectral bands acquired by the OLI/TIRS and OLI-2 / TIRS-2 instruments, respectively.
Designed to See More: Two New Bands, and a Split Thermal Band
Landsat 9, like Landsat 8, is designed to simultaneously image four visible spectral bands, one near-infrared spectral band, three shortwave-infrared spectral bands at 30 m (98 ft) spatial resolution, plus one panchromatic band at 15 m (49 ft) spatial resolution, and two thermal bands at 100 m (328 ft) spatial resolution. See what the Landsat 8 bands can do… Landsat 9 follows suit. Landsats 8 and 9 are designed to see two additional parts of the spectrum. These new bands help scientists measure high, thin clouds and water quality.

Coastal/Aerosol Band (Band 1)
This band helps scientists measure chlorophyll concentrations (ocean color) in coastal regions. Most of the chlorophyll comes from phytoplankton, tiny plant-like organisms that live in surface waters. This band is also useful for aerosol detection.

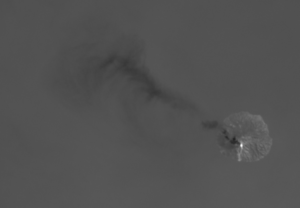
Cirrus Band (Band 9)
High, thin cirrus clouds can be hard to spot in satellite images. Both the clouds and their shadows can interfere with measurements. Landsats 8 and 9 are designed to detect these clouds by measuring light in the part of the electromagnetic spectrum where the clouds are most visible.
Two Thermal Infrared Bands (Bands 10 & 11)
Everything on Earth emits thermal infrared radiation. The amount of emitted radiation depends on the object's temperature. Landsat 9, like Landsat 8, images data for two distinct thermal infrared spectral regions. The stray light issues that have plagued Landsat 8 were corrected for Landsat 9.