
The OLI-2 relative spectral response (RSR) is being re-released to provide a continuous in-band and out-of-band dataset. The spectral data were reassessed after the instrument-level tests to determine the best combination of data for a full-spectrum spectral response. The in-band spectral responses are from the measurements made of the fully assembled instrument under thermal vacuum (TVAC) conditions conducted at Ball Aerospace, the instrument vendor’s facility, using the Goddard Laser for Absolute Measurement of Radiance (GLAMR) facility. The out-of-band results come from the best available measurement, either the GLAMR results, the module-level tests or the component-level tests.
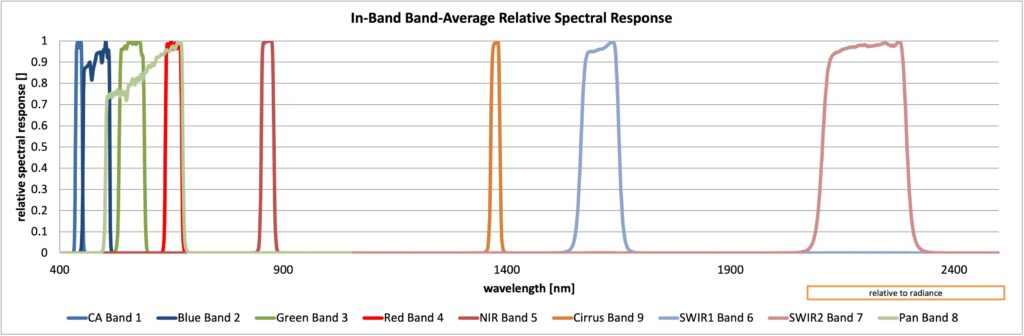
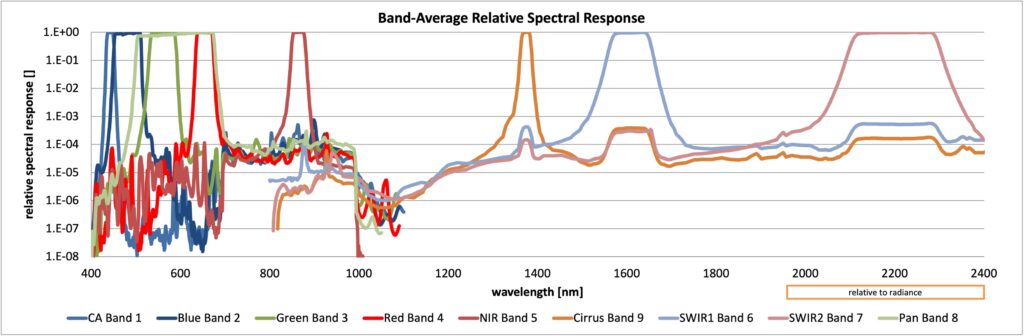
The RSRs are shown in Figure 1 for all bands, scaled to only show the in-band response range, and per-band summary is provided in Table 1. Figure 2 shows the band-average out-of-band response.
| Band | Band Width [nm] | Lower Band Edge [nm] | Upper Band Edge [nm] | Center Wavelength [nm] |
| CA | 15.51 | 435.06 | 450.57 | 442.81 |
| Blue | 59.87 | 451.96 | 511.82 | 481.89 |
| Green | 56.50 | 532.71 | 589.20 | 560.95 |
| Red | 36.88 | 635.88 | 672.76 | 654.32 |
| NIR | 28.77 | 850.26 | 879.03 | 864.64 |
| SWIR1 | 86.15 | 1565.08 | 1651.22 | 1608.15 |
| SWIR2 | 189.48 | 2105.38 | 2294.86 | 2200.12 |
| Pan | 172.47 | 503.09 | 675.56 | 589.32 |
| Cirrus | 20.90 | 1363.68 | 1384.57 | 1374.13 |
Table 1. Summary statistics of the Version 2 band-average relative spectral radiance responses of the OLI-2.
The band-average RSRs are in L9_OLI2_Ball_BA_RSR.v2.xlsx.
The average RSR over each of the 14 Focal Plane Modules (FPMs) per-band are in L9_OLI2_Ball_FPMavg_RSR.v2.xlsx. This module-average file also includes the spectral responses for several individual detectors as a sample of where the focal plane is less uniform, as illustrated in Figure 3.
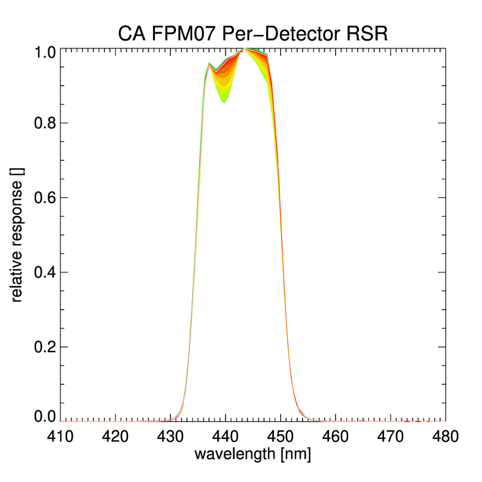
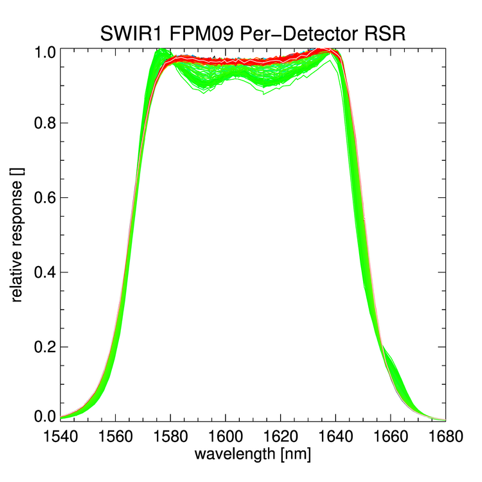
Figure 3 . The per-detector RSR for the CA band FPM07 (left) and SWIR1 FPM09 (right). On these plots, each detector’s RSR is represented by a different color, Both of these modules are affected by what is likely an imperfection in the filter. A subset of the detectors on each of these modules has a lower response for some wavelengths than the rest of the module.
More details on the characterization of the OLI-2 spectral responses can be found in Barsi, 2019 and Barsi, 2024.
The previously released versions of the relative spectral response have been archived. They should be replaced with the Version 2 RSRs in analysis. The archived versions can be found here (in-band) and here (out-of-band).
References
Julia A. Barsi, Brian L. Markham, Joel McCorkel, Brendan McAndrew, Eric Donley, Eric Morland, James Pharr, Michael Rodriguez, Tim Shuman, Andrei Sushkov, Barbara Zukowski, “The Operational Land Imager-2: prelaunch spectral characterization,” Proc. SPIE 11127, Earth Observing Systems XXIV, 111270B (9 September 2019); https://doi.org/10.1117/12.2529776
Barsi, J.A.; Donley, E.; Goldman, M.; Kampe, T.; Markham, B.L.; McAndrew, B.; McCorkel, J.; Morland, E.; Pedelty, J.A.; Pharr, J.; et al. “Prelaunch Spectral Characterization of the Operational Land Imager-2.“ Remote Sens. 2024, 16(6), 981; https://doi.org/10.3390/rs16060981
