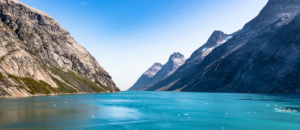
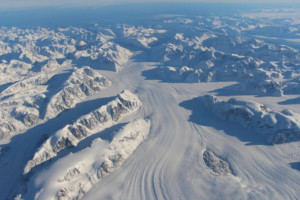
Mapping Circulation Patterns of Icy Fjords
“Great insight comes from thinking in multi-sensor and using several constellations together.”

“Great insight comes from thinking in multi-sensor and using several constellations together.”

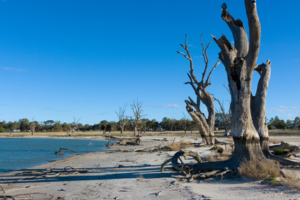
Stanford research shows the drying trend in Canada’s Peace-Athabasca Delta is linked to the long-term decline in populations of the semi-aquatic muskrat.
The patterns of large-scale tropical deforestation endure across landscapes, even after more than a half-century of tropical rainforest expansion and growth.
Multi-year comparison of Landsat images can unmask previously unknown geography.
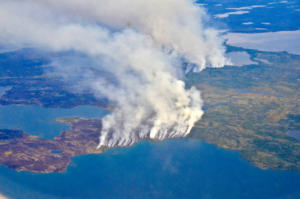
The 2014 megafires in Canada’s Northwest Territories burned 7 million acres of forest, making it one of the most severe fire events in Canadian history.
As global temperatures rise, melting permafrost is expected to cause more frequent and hazardous landslides.
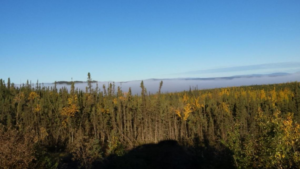
This is the first study to document more than three decades of land and water changes across Alaska.
Using a quarter century of Landsat data, geospatial researchers have mapped and modeled how vegetation responds to water availability across the entire Murray-Darling Basin.
A NASA study based on an innovative technique for crunching torrents of satellite data provides the clearest picture yet of changes in Antarctic ice flow into the ocean.
Revealing the dynamic nature of glaciers.
Glaciers have been receeding rapidly in many parts of the world, including New Zealand.
Modeling the aboveground biomass and carbon of tidal marshes across the U.S.
Using Landsat 8’s thermal data to monitor calving events in Antarctica.
Using Landsat data from 1984-2014 to investigate the blue carbon change in Louisiana’s coastal marshes.
A NASA study has located the Antarctic glaciers that accelerated the fastest between 2008 and 2014 and finds that the most likely cause of their speedup is an observed influx of warm water into the bay where they’re located.
The large rift that eventually formed iceberg A68 initially broke through a suture zone in the southern part of the ice shelf that had previously stabilized neighboring rifts for at least 80 years.
The Thermal Infrared Sensor (TIRS) on Landsat 8 captured a new snap of the 2,240-square-mile iceberg that split off from the Antarctic Peninsula’s Larsen C ice shelf on July 10-12.
A new Landsat-based data portal enables scientists to study in unprecedented detail how fast outlet glaciers such as this one move and change over space and time.
Scientists are providing a near-real-time view of every large glacier and ice sheet on Earth with Landsat 8.
The water year 2015 peak snowpack was found to be the lowest over the 65-year reconstruction of peak annual snow water equivalent.
Looking at the causes of carbon loss in Pacific Northwest forests.
How the urban heat island of Boston affects the growing season of vegetation in and around the city.
The extensive Landsat record has been analyzed to map the climatalogical normal date of snowmelt for large areas of the Arctic.
In May 2015, a severe glacier surge struck the eastern Pamir.
How the El Niño Southern Oscillation impacts snow cover of a glacierized volcano in Peru.
The glaciers of Puncak Jaya have continued their decline.
The carbon implications of 45 years of land use and land cover change in the conterminous U.S.
Using Landsat to closely monitor changes in ‘grounding line’ position in West Antarctica.
From the Arctic to the Mojave Desert, terrestrial and marine habitats are quickly changing. Satellites are particularly well-suited to observe habitat transformation and help scientists forecast what animals might do next.

How do glaciers respond to present climate change, in particular how have ice flows evolved over the last few decades?