
Preliminary Results Created by Dr. Petya Campbell, STELLA Lead Scientist
ASD Reflectance Measurements
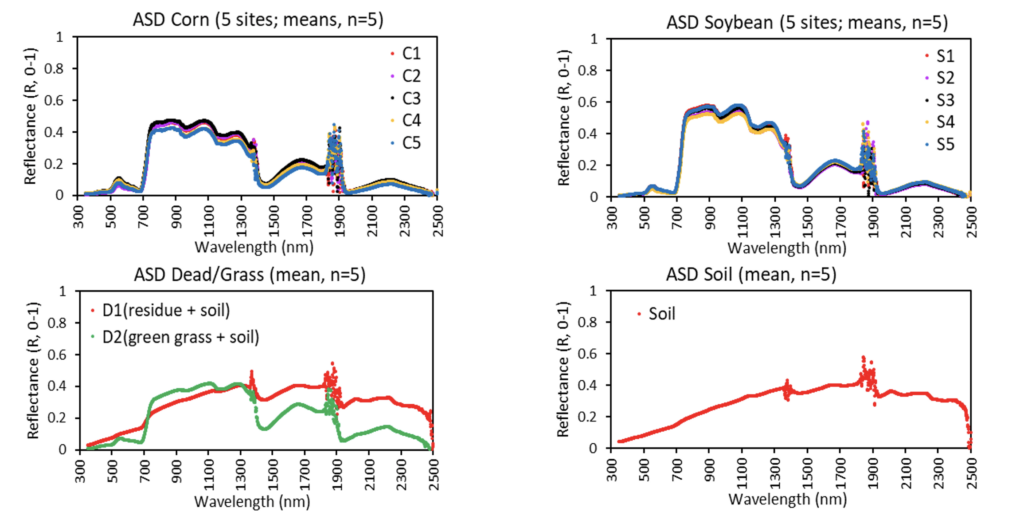
- The R spectra appears relatively clean, however in the water absorption bands (~ 1400 nm and 1900 nm) we can clearly see the effects of the varying aerosols in the air during the collection. The data was collected by measuring panel and target as a ‘sandwich’, which helped.
- Corn R varied in the VIS, NIR and SWIR regions, related to canopy greenness, LAI and structural compounds.
- Soybean R varied mostly in the NIR (related to canopy density and LAI)
- In general, larger variation in canopy R was observed for corn as compared to soybean
- Looking at the reflectance of the grass and dead vegetation (residue) you can see a slight red-edge feature in the D1 reflectance
STELLA Bands - variation during the measurements
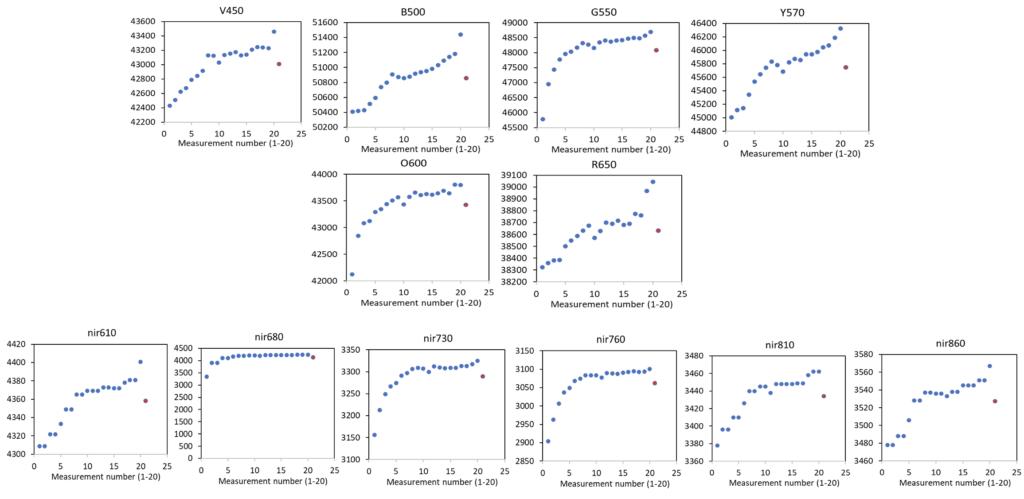
- With Stella we collected 20 consecutive measurements at each band.
- NIR band 680 shows the least variation during the data collection, however all other bands show higher variation in the beginning and very end of the set of measurements in the collection.
Preliminary Comparison of STELLA and ASD
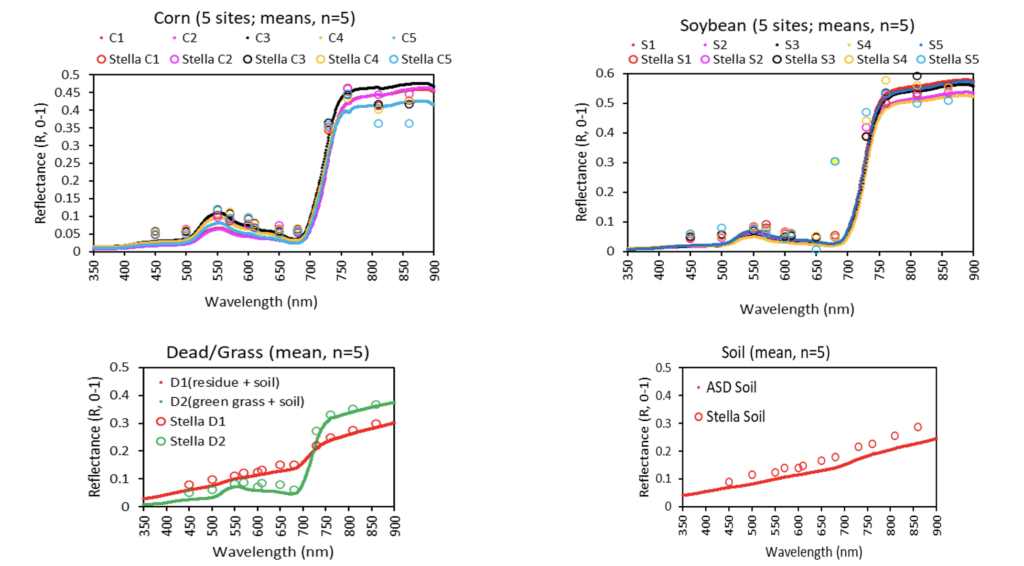
- In general, there is some correspondence between the ASD and Stella measurements, which is most pronounced for the dead/residue and green grass.
- There is also a significant variation in the data for corn, soybean and soil.
- For the soil measurement the Stella variation appears to be consistently higher as compared to the ASD, which could be due to a difference in the sensor/target/sun measurement geometry.
- For corn and soybean, the variation in the data appears relatively random, so it could be due to the variation in the 20 consecutive measurements we took. Perhaps, to reduce the variation will be best to calculate the means using the set of ‘median’ values?
Comparison Field Reflectance Measurements of ASD Convolved to STELLA with STELLA
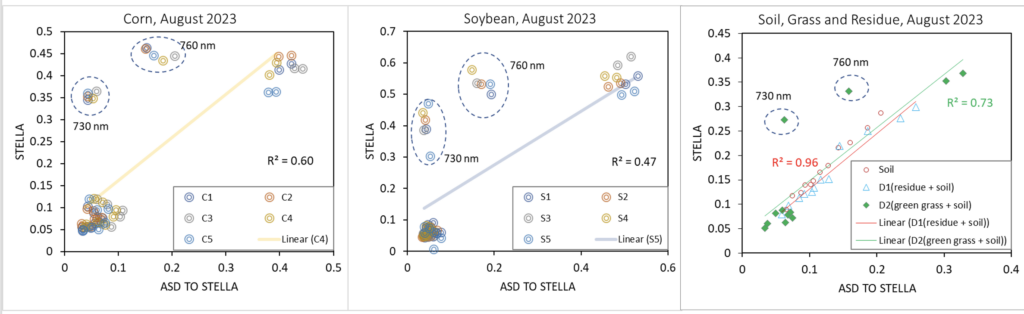
- For all samples and ground covers the following reflectance bands compared well: 450, 500, 550, 570, 600, 650, 610, 680, 810 and 860 nm
- The reflectance measurements collected from corn, soybean and grass with Stella at 730 nm and 760 nm were significantly higher as compared to the ASD reflectance convolved to Stella.
- The differences in the observation geometry using ASD and Stella and the effects from the vegetation canopy heterogeneity are likely leading to the observed differences in the 730 nm and 760 nm bands.
Next Steps
- Use the ‘median’ values to calculate the means, or use the last 10 Stella measurements in the set of 20 (lower variation)
- Compare Stella versus ASD vegetation indices (e.g., NDVI, SR, Clre, etc.)
- Use the Stella band gains and response functions with the ASD data for direct ASD vs. Stella band comparison
