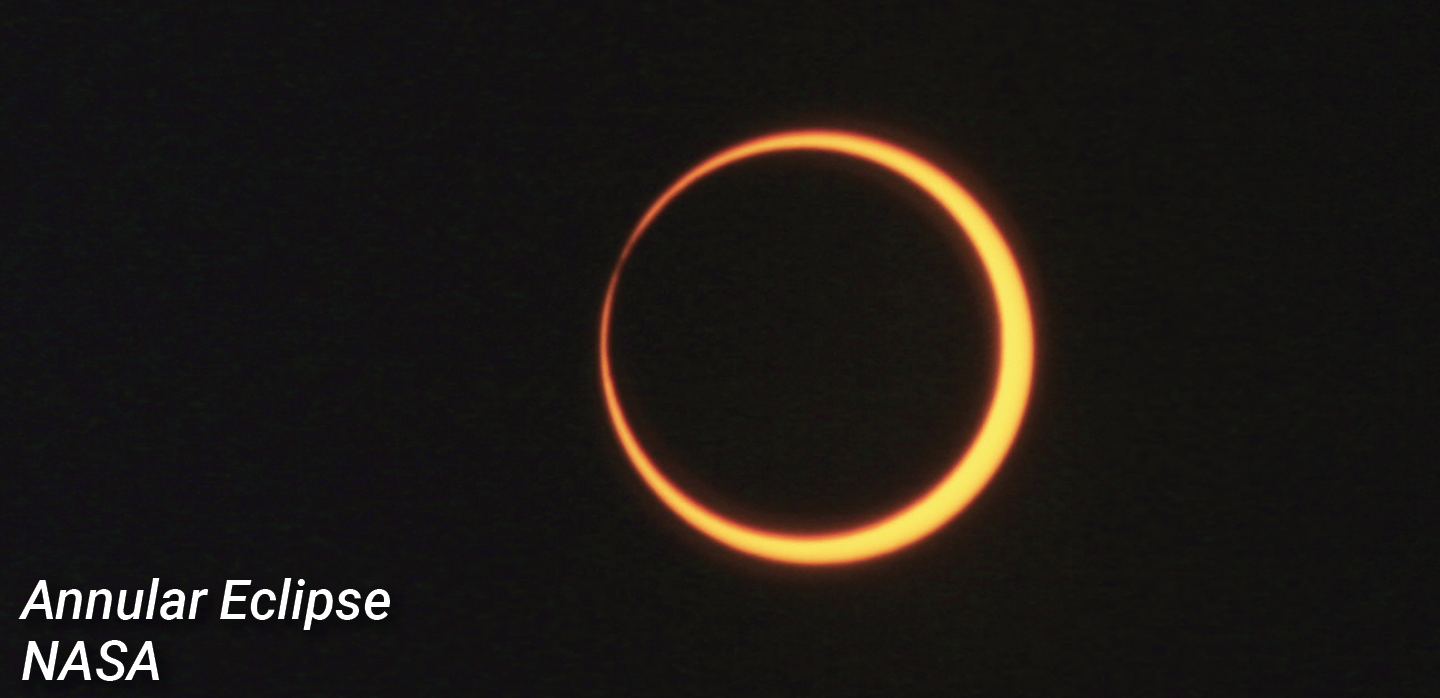
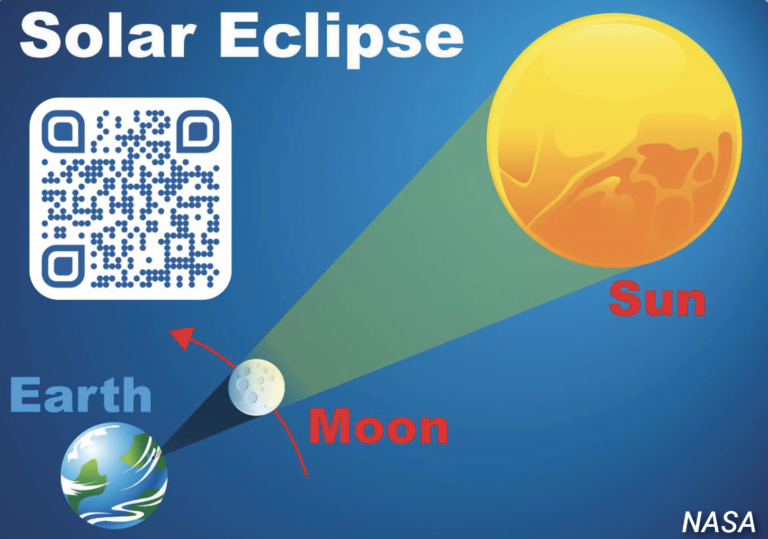
What is a Solar Eclipse?
A solar eclipse happens during the new moon phase when the moon passes between the sun and the Earth. With the sun, moon, and Earth perfectly aligned, the moon casts a shadow on the Earth that either fully or partially blocks the sun’s light. Solar eclipses only happen occasionally because the moon does not orbit in the exact same plane as the sun and Earth. Read about the types of solar eclipses at https://science. nasa.gov/eclipses/types/.
How is Temperature Affected?
When daylight fades to twilight, temperatures begin to cool due to the decrease in solar radiation. The same is true for the temporary dimming during a solar eclipse. The amount of temperature change varies based on location, duration, time of year, and type of eclipse. During a total solar eclipse, the sky will become dark along the path of totality, as if it were dawn or dusk, and the temperature will decrease by several degrees.

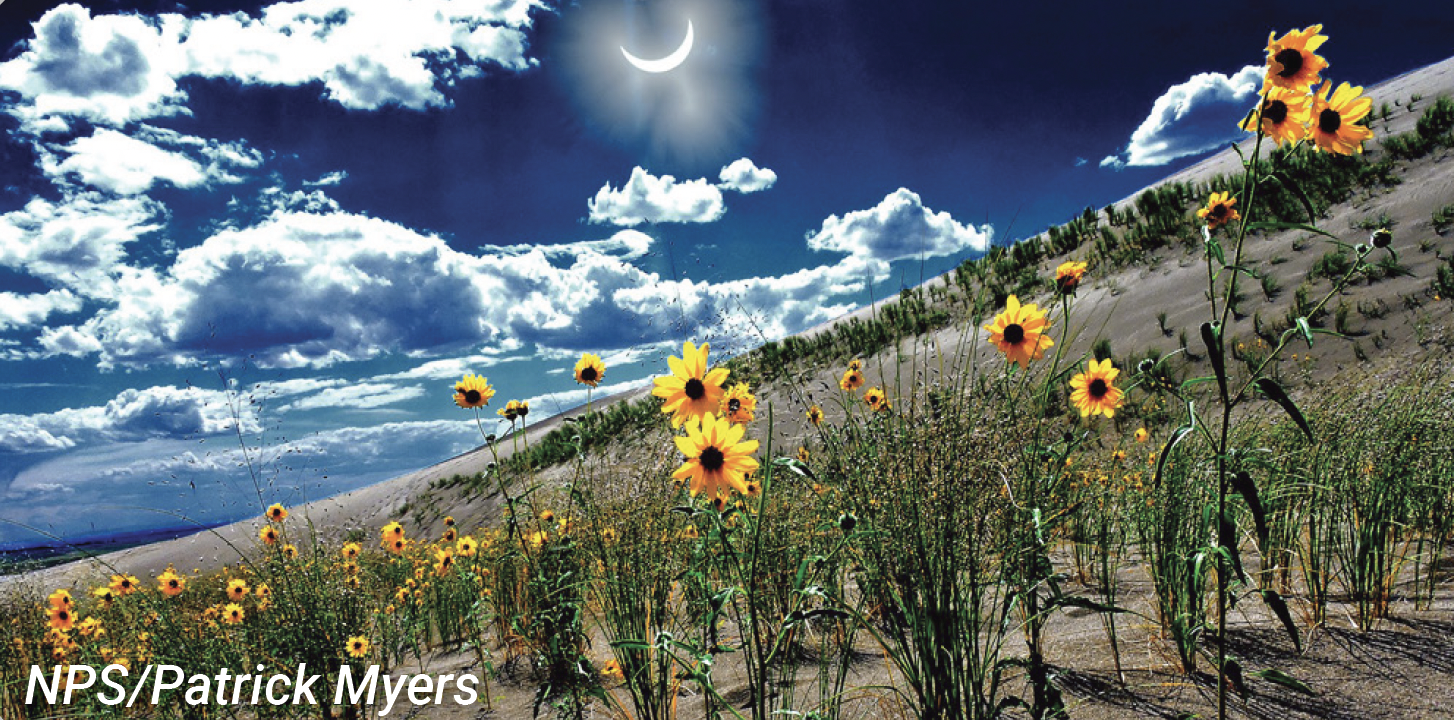
How are Plants Affected?
Since plants rely on the sun for photosynthesis, many species have a reaction to the changing light levels during a solar eclipse. Experiments have shown that plants experience a decrease in photosynthesis and transpiration and often respond as if it were dusk. Other effects may include changes in sap flow or opening or closing of flowers or buds.
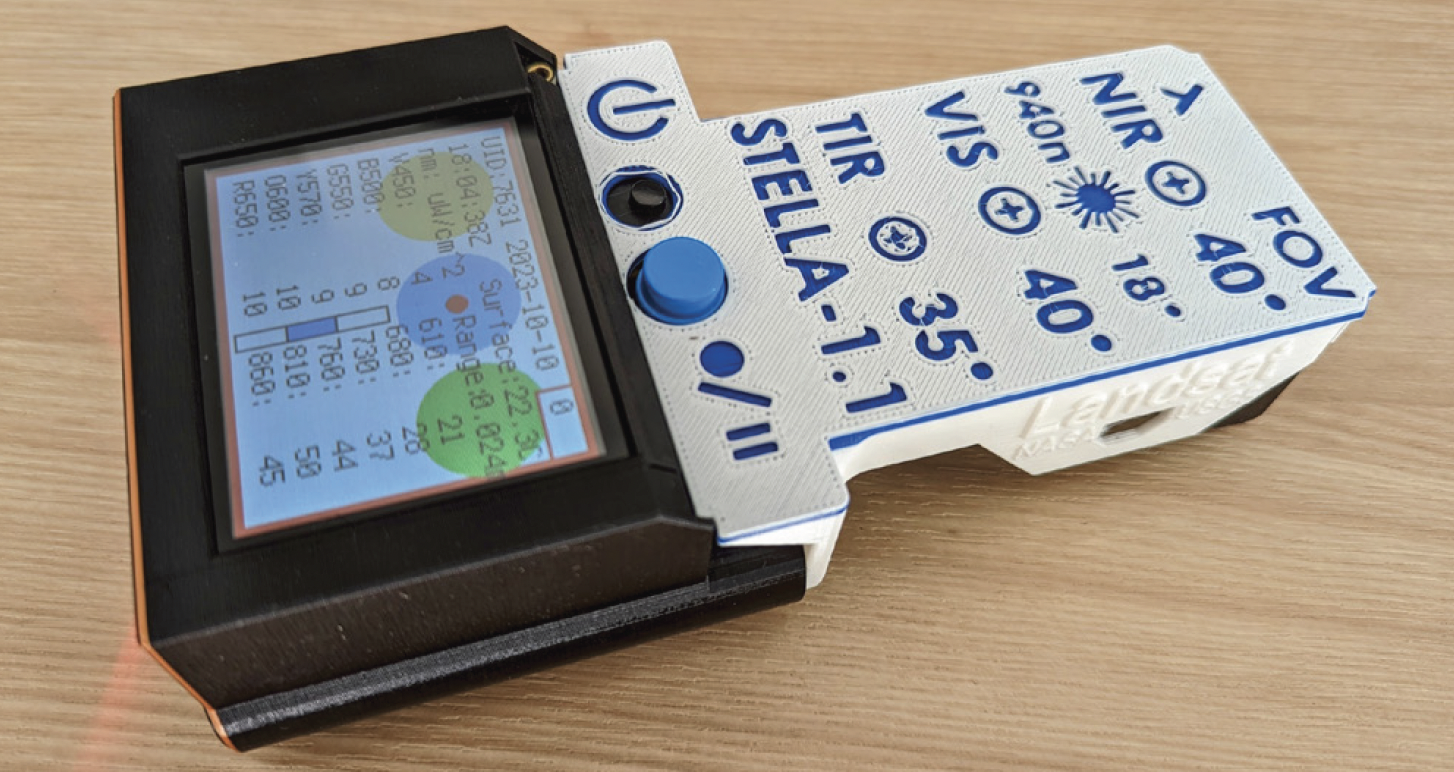
What is STELLA?
STELLA (Science and Technology Education for Land/ Life Assessment) is an instrument that supports science education and outreach by providing learners of all ages a hands-on experience with remote sensing technology. STELLA records measurements of reflected light and temperature. It functions as a spectrometer to measure the intensity of light reflected from surfaces, such as plant cover, across a range of wavelengths.
Overview
This activity will use a STELLA instrument to assess how changing light levels during a solar eclipse affect spectral responses and temperature. By using the continuous data collection mode, spectral and thermal measurements can be collected before, during, and after the solar eclipse. The data can then be viewed in the STELLA Data Viewer or a spreadsheet software to determine when and where changes occurred.
List of Materials
- STELLA instrument
- Micro SD card and micro SD card reader
- Tripod or wooden dowel
- Computer with spreadsheet application
Step 1: Record Your Location
Go to https://timeanddate.com/eclipse and enter in your city or place to find out when the solar eclipse will begin in your location. Record the following information:
Date: _______________________________________________
Global Event: _______________________________________
Local Type: _________________________________________
Begins: ____________________________________________
Maximum: _________________________________________
Ends: ______________________________________________
Duration: __________________________________________
Step 2: Identify a Sample Area
When selecting an area to sample, choose a plant cover or surface that does not have a lot of variability or heterogeneity. Examples include crops, grasses, trees, shrubs, or pavement (sidewalks or driveways).


Step 3: Set Up STELLA
Based on the times in the first step, set up your STELLA instrument on a tripod prior to the start of the solar eclipse. Set it up so it is approximately one meter away from the sample surface and make sure that you or the equipment will not cast a shadow on the surface. If you do not have a tripod, you can hold the instrument or use a wooden dowel and record data for a shorter period of time.
Step 4: Take Some Photographs
Take a few photographs of your sample area and document the vegetation type or surface. Make any other observations about the site, such as the health of the plants.


Step 5: Collect Data
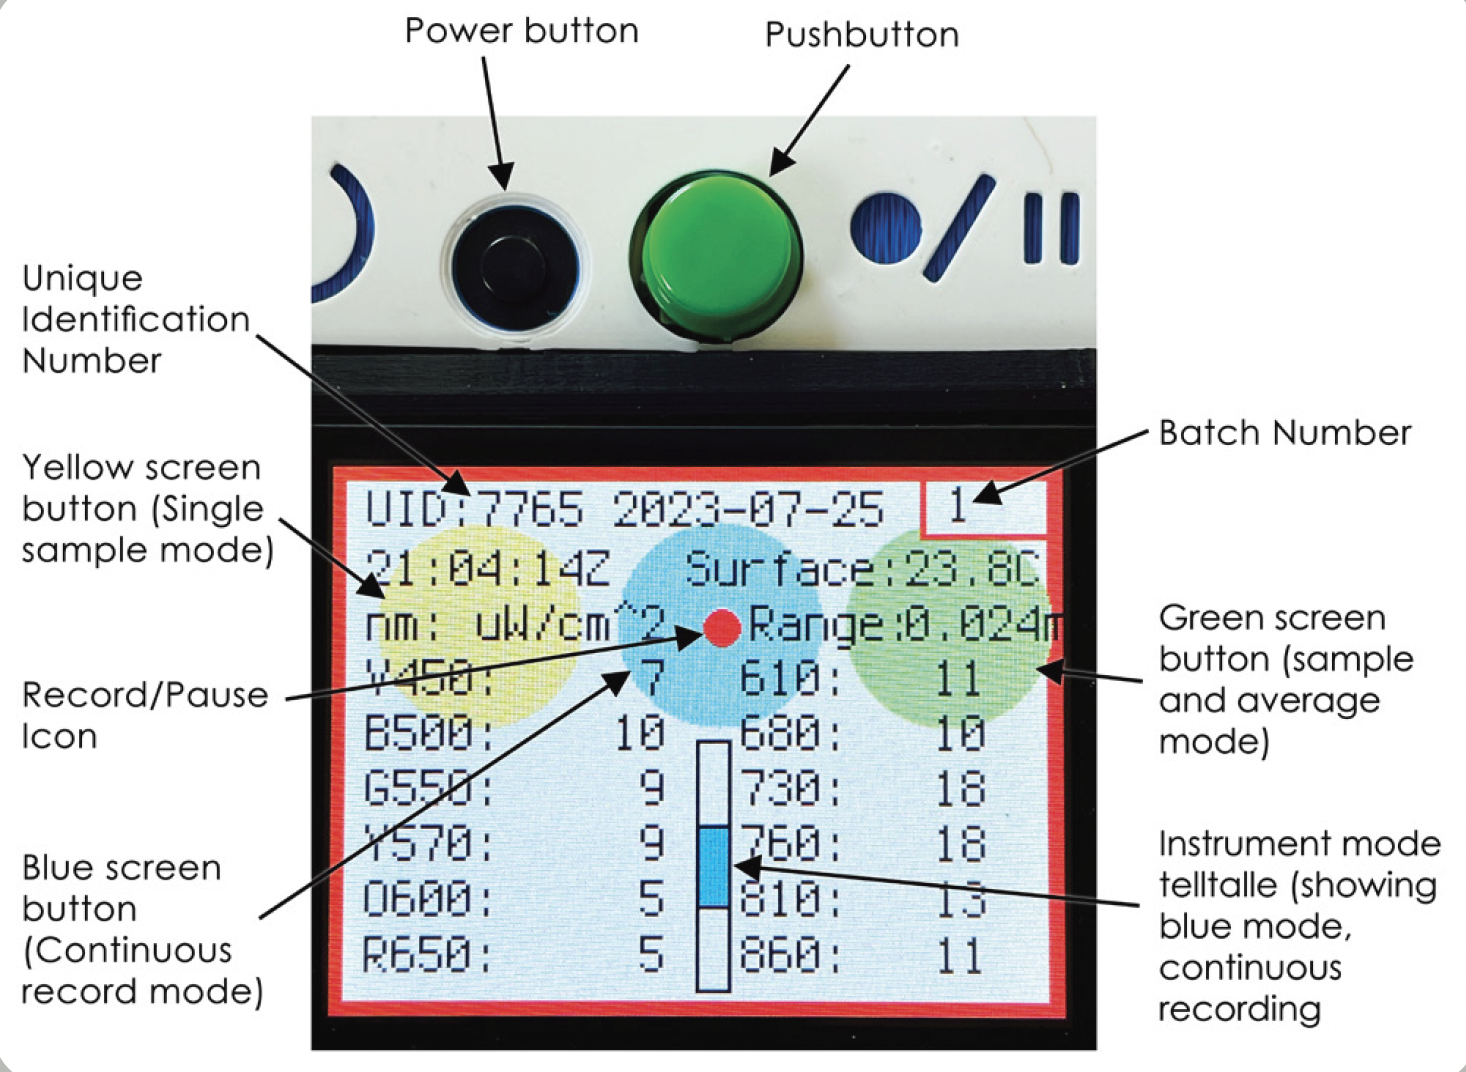
STELLA spectrometers collect data in three different modes. The Single Point Mode (Yellow Dot) records a single data point. The Continuous Mode (Blue Dot) collects data continuously at one-second intervals. The Sample and Average Mode (Green Dot) takes a series of points and calculates the average. For this activity, you will collect data using the Continuous Mode because the goal is to see how spectral and thermal measurements change during the solar eclipse. Select the Continuous Mode by pressing the blue dot on the screen. Data points will start being collected and a red dot in the middle of the blue dot will appear. The red light on the bottom of the instrument will also flash each time a data point is collected.
Step 6: Download Data
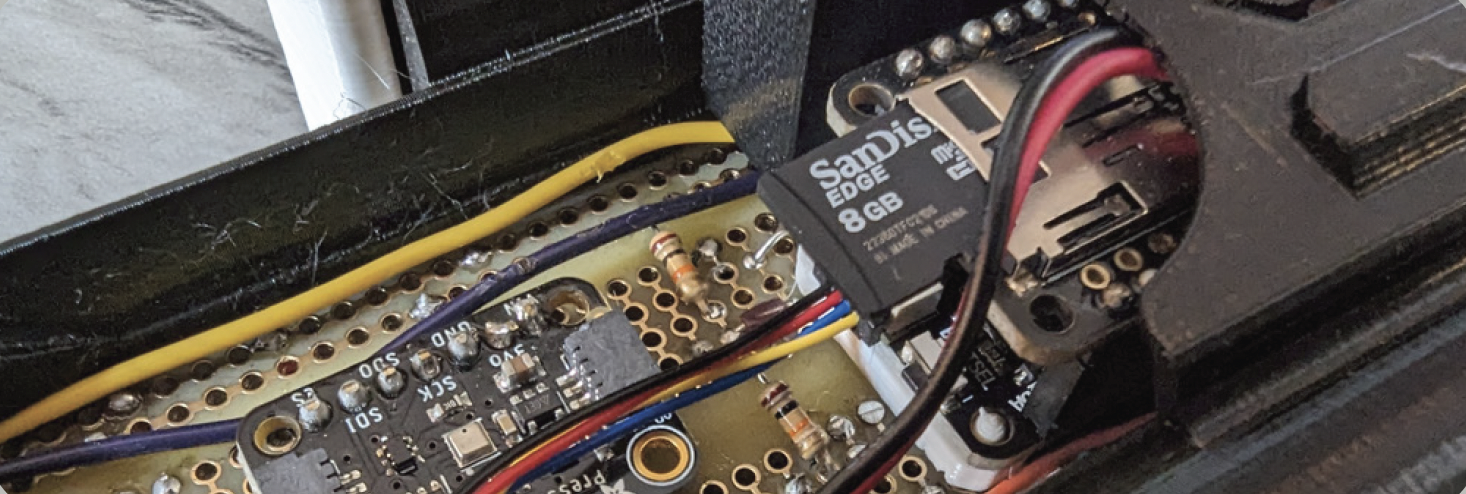
Remove the micro SD card from the back of the STELLA instrument and copy the data to a computer using a card reader. The data are collected and stored in a CSV (comma-separated values) file that can be opened in a spreadsheet application or displayed in the STELLA Data Viewer.
Step 7: View Data
To view the data, open the CSV file in a spreadsheet application, such as Microsoft Excel or Google Sheets. To evaluate the changes in spectral and thermal responses during different light levels, you will want to graph the data against the timestamp field noted in the CSV file. You will want to create two graphs, one displaying the visible and infrared spectral data and one displaying the air and surface temperature data.
- Select the data range you want to plot, including the time in one column and the corresponding data in the adjacent columns.
- Go to the Insert tab and select the Line chart type from the dropdown menu.
- Using the Chart Design and Format tabs, you can customize the chart by adding labels, titles, and colors.

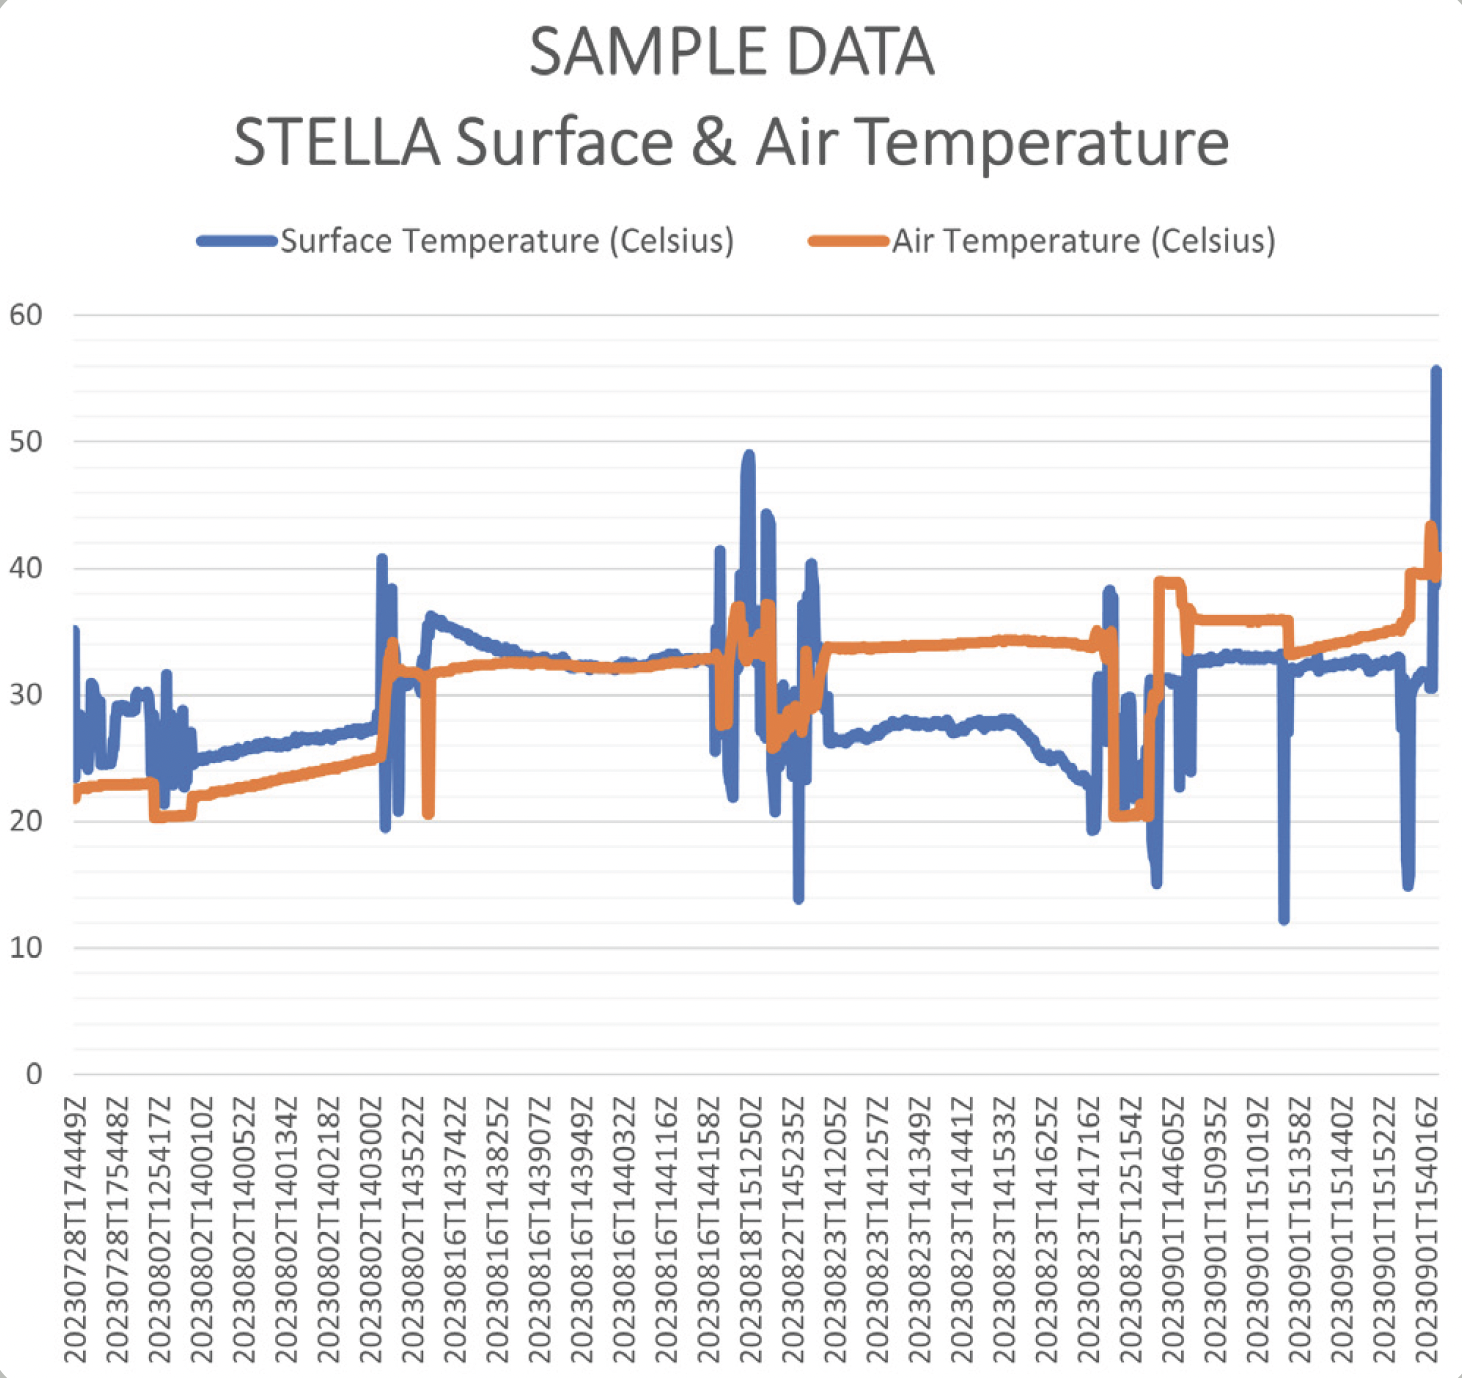
STELLA instruments record data in Coordinated Universal Time (UTC), a world time standard which does not have timezone offsets. The format for the timestamp in the CSV file is noted by a 16 digit code that represents the date and time. For example, a timestamp of 20230728T174449Z is July 28, 2023 at 17:44:49 UTC (or 5:44:49 PM UTC).
Step 8: Analyze Data
Based on the graphs you created, what changes occurred during the solar eclipse? Record your observations and answer the following questions.
- Were there notable changes in the spectral responses during changing light levels? If so, what changes did you observe?
- If your sample area was vegetation, what changes do you see in the infrared wavelength compared to other wavelengths?
- How many degrees did the temperature drop during the solar eclipse?
- Do you think that locations experiencing full annularity or totality have greater temperature variations than those that only experience a partial solar eclipse?
- Aside from the shadow of the moon, what other variables might affect the air temperature during this time?
Discussion
The sun provides the Earth with most of its energy. Roughly 70 percent of the sunlight that reaches the Earth is absorbed by the oceans, land surface, and atmosphere. As the Earth absorbs solar radiation, the surface warms the air. The more sunlight a surface absorbs, the warmer it will get and the more heat it will re-radiate. During a solar eclipse, there is a decrease in solar radiation as the sun’s light is partially or fully blocked by the shadow of the moon. The reduction of incoming solar radiation slows down photosynthesis in plants and causes a drop in surface and air temperature. Surfaces like asphalt and concrete will retain more heat and cool down slower than surfaces with plant cover. STELLA instruments can help learners of all ages learn more about these changes.

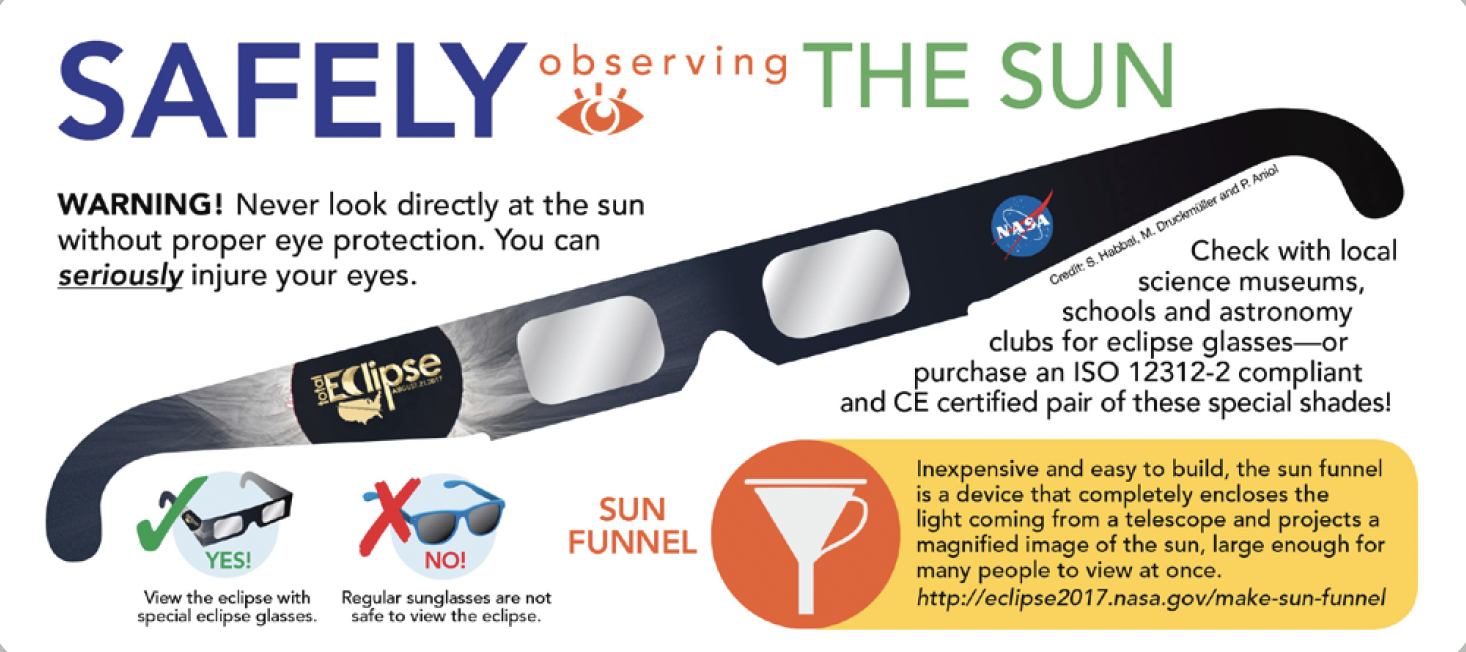
Solar Eclipse Safety
When watching a solar eclipse, never look directly at the sun without safe solar eclipse viewing glasses. Never look at the sun through sunglasses, a camera, a telescope, or binoculars. Safe solar eclipse glasses should comply with the ISO 12312-2 standard. If you do not have safe solar eclipse viewing glasses, you can use an indirect viewing method, such as a pinhole projector or sun funnel.
Resources
NASA GLOBE Solar Eclipse Journal – https://science.nasa.gov/learn/heat/resource/ globe-solar-eclipse-journal-student-sheet/
NASA GLOBE Educator One-Week Pacing Guide- https://solarsystem.nasa.gov/resources/3025/ globe-educator-one-week-pacing-guide-experiencing-a-solar-eclipse/
How does a Solar Eclipse Affect Air Temperature? – https://mynasadata.larc.nasa.gov/mini-lessonactivity/how-does-solar-eclipse-affect-air-temperature
NASA Solar Eclipse Resources – https://science.nasa.gov/eclipses/resources/