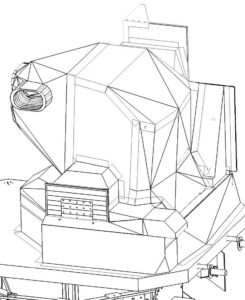
Letter Contract for Landsat 9 Imager-2 Awarded
NASA has awarded a sole source letter contract to Ball Aerospace & Technologies Corporation, Boulder, Colo., to build the Operational Land Imager-2 instrument for the Landsat 9 project.

NASA has awarded a sole source letter contract to Ball Aerospace & Technologies Corporation, Boulder, Colo., to build the Operational Land Imager-2 instrument for the Landsat 9 project.
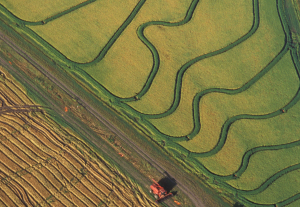
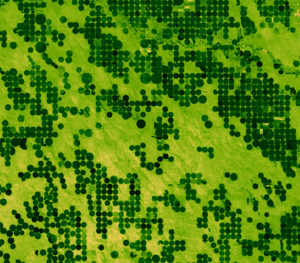
Liheng Zhong, a Senior Delineator with the California Department of Water Resources is working on a way to map rice fields with Landsat to better manage water use. He presented some of this findings at #AGU15, here’s what he shared with us.
Shengli Tao, from Peking University, has used the Landsat data archive to map, measure, and investigate the shrinking lakes of the Mongolian Plateau. We spoke to Tao about the work he presented at #AGU15.
At #AGU15, Amy Hudson, from the University of Maryland College Park, presented a poster about her work to develop a global surface water dynamics map for the years 2000–2014 using data from three Landsat satellites. We spoke with her about this effort.
Alex Gardner, a Research Scientist at NASA’s Jet Propulsion Laboratory, has used 30 years of Landsat data—some 3 million scenes—to measure the velocity of Antarctica’s ice sheet. He spoke with us about the work he is presenting at #AGU15.
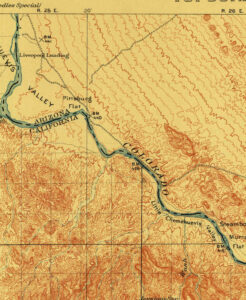
Joshua Ahmed from Cardiff University studies how river meanders evolve. Using Landsat data to examine river movement through time, his team has made new observations about river channel change. He presented his findings at #AGU15.
Naga Manohar Velpuri, works with the USGS Famine Early Warning Systems Network (FEWS NET). The project has recently initiated a large-scale project to monitor surface water bodies in the pastoral regions of Africa using multi-source satellite data and hydrologic modeling techniques. Currently, a total of 293 water points are being monitored in 10 countries. Velpuri shared some of the projects findings he presented at #AGU15.
Carson Baughman, a geographer at the USGS Alaska Science Center, presented results of his study on seasonal glacial sediment plumes in Alaska’s Lake Clark at #AGU15. We talked to Carson about his work.
Justin Roberts-Pierel from the Joint Center for Earth Systems Technology, uses Landsat 8 to detect landslides in the Himalayas. He provided information about his studies at #AGU15. We talked with him about his work.
Alex Riter, a graduate student at the University of Maryland College Park, presented her finding on how Hurricane Sandy affected New Jersey coastal marches at #AGU15. We talked to Riter about her research.
At #AGU15 Yurika Kato, a Geosciences graduate student at the University of Missouri-Kansas City, presented his research about how the 2010 Haitian earthquake and resulting human migration affected landslide occurrences in the Port-au-Prince province. We spoke with Kato about his research.
Sara Lubkin, previously with the NASA DEVELOP program, presented a poster at #AGU15 on her work using Landsat data in concert with MODIS data to measure chlorophyll levels in the Chesapeake Bay. We spoke with Lubkin about her work.
Alex Burton-Johnson, Martin Black, and Peter Fretwell from the British Antarctic Survey have used Landsat 8 data to create a new rock outcrop map for Antarctica, which will become part of the Antarctic Digital Database. The team presented their research at #AGU15.
David Selkowitz, a Research Geographer with the USGS Alaska Science Center, and his team have developed a snow cover product, that allows users to look at historical snow cover through time. Selkowitz presented a poster on the Landsat-based data product at #AGU15. Here’s what we learned from him this week.
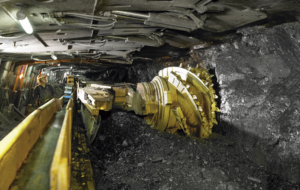
Erin Pfeil-McCullough, a graduate student at the University of Pittsburgh, gave a talk at #AGU15 on insights that she has gained from her research to determine what impacts longwall mining has on forest canopies above as the ground subsides and local hydrology is altered.
Chase Mueller from NASA Ames Research Center shared the results of a project that uses Landsat and MODIS data to monitor water quality trends at #AGU15. We spoke with him about his findings.
Elodie Robert from the French National Center for Scientific Research presented preliminary results of her research at #AGU15 that aims to track microbiological heath hazards based on surface water turbidity in West Africa.
Courtney Reents, a graduate student at University of Illinois at Urbana-Champaign, presented a poster on forest disturbance in California at #AGU15.
William Kochtitzky, a student from Dickinson College, presented a poster on glacial changes on Peru’s Nevado Coropuna volcano at #AGU15.
Charles Perry, a Research Soil Scientist with the USDA’s Forest Inventory and Analysis group, gave a talk about his research that uses Landsat to monitor land use and land cover change in watersheds surrounding the Great Lakes at #AGU15. He is able to link the land use and land cover change information with other ancillary data to predict water quality, such as the amount of phosphorus (which feeds algae) in the lakes.
Jennifer Rover, a Geographer with the U.S. Geological Survey, gave a talk on an automated method she developed to assess long-term change to Earth’s surface using Landsat at #AGU15.
Chengquan Huang presented a poster explaining where to find U.S. forests that have been undisturbed for last 25 years at #AGU15. His research relied on Landsat to both find these forests and understand forest disturbance trends in the U.S.
Martin Goldhaber gave a talk about how climate change will impact the hydrochemistry of wetlands in an immensely important ecosystem known as the Prairie Pothole Region at #AGU15. Landsat data helped Goldhaber track how the size of the waterbodies in his study area changed between 1973 and 2011. Here’s what he shared with us about his research.

At this year’s AGU Fall meeting over 325 presentations feature research done using Landsat data. The Landsat-related papers and posters run the gamut of disciplines from cryosphere to biogeoscience to hydrology to global environmental change to natural hazards to informatics.
When you think of Southern Florida’s vast everglades, fire is not something that usually comes to mind, but the region has a long history of seasonal fires.
Capitalizing on the long Landsat data record and the human brain’s capacity to recognize movement, Frank Paul from the University of Zurich has created glacier animations that enable viewers to witness the complex flow of glaciers.
Every part of the mosaic of Earth’s surface — ocean and land, Arctic and tropics, forest and grassland — absorbs and releases carbon in a different way. Wild-card events such as massive wildfires and drought complicate the global picture even more. To better predict future climate, we need to understand how Earth’s ecosystems will change as the climate warms and how extreme events will shape and interact with the future environment.
Ice sheets are in perpetual motion, making their way downslope like a river. If the amount of snow that an ice sheet accumulates does not keep pace with its loss to the sea, sea level will rise. As temperatures have climbed, positive feedback loops have led to an accelerated loss of ice sheet sections that touch the sea, but in an unexpected twist to the global warming saga, scientists have just discovered a negative feedback loop that is slowing down the Greenland Ice Sheet sections that end on land—a sliver of good news for sea-level rise.
Parker Dam was constructed on the California-Arizona border on the lower Colorado River during the 1930s, as part of a project to employ people during the Great Depression, to generate electricity, and to provide water that could be pumped into aqueducts for agricultural, industrial, and residential use in other parts of Arizona.
The World Economic Forum has published a talk given by Illah Nourbakhsh, professor of robotics from Carnegie Mellon and Matthew Hansen, a remote sensing specialist at the University of Maryland, that demonstrates how visualizing big data can revolutionize the way we understand and imagine the world.
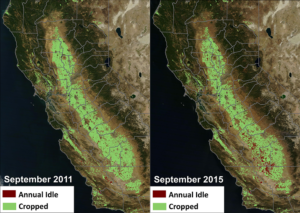
NASA, in collaboration with the United States Department of Agriculture (USDA), United States Geological Survey (USGS), and the California Department of Water Resources, released data today showing the effect the current drought has had on agricultural production and the idling of California farmlands.
Imagine you’re flying 438 miles above the Earth taking pictures and collecting information of everything below. What do you see? Now imagine you’ve been doing this non-stop for over 40 years. Do you notice any change?
This fall scientists at the University of Nebraska, with partners at Google Inc., the University of Idaho and the Desert Research Institute, introduced the latest evolution of METRIC technology—an application called EEFLUX, which will allow anyone in the world to produce field-scale maps of water consumption.
