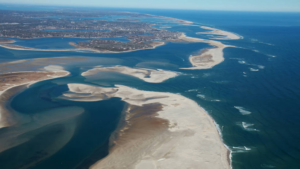
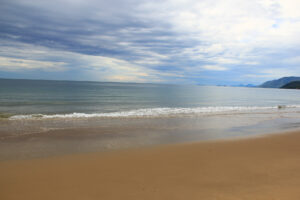
Landsat-based Global Study of World’s Beaches Shows Threat to Protected Areas
Using 30 years of Landsat data, a team of scientists and engineers from the Netherlands determined how Earth’s sandy beaches are changing.

Using 30 years of Landsat data, a team of scientists and engineers from the Netherlands determined how Earth’s sandy beaches are changing.
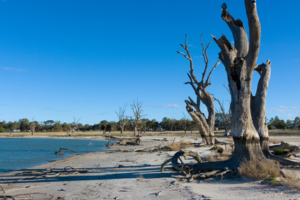
Using a quarter century of Landsat data, geospatial researchers have mapped and modeled how vegetation responds to water availability across the entire Murray-Darling Basin.
Earth’s wet land areas are getting wetter and dry areas are getting drier due to a variety of factors, including human water management, climate change and natural cycles.
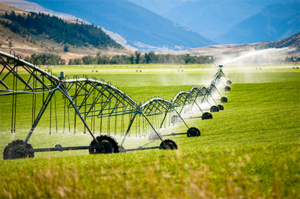
Researchers armed with data from the Landsat Earth-observing satellites recently teamed up with Google to track water used for irrigation.

A team of Norwegian-based researchers has developed an innovative way to describe how much land it takes to generate a kilowatt-hour of electricity from hydropower.
The area of mangrove wetlands around the world has been declining over recent decades.
Using Landsat to measure river widths around the world.
Learn more about the huge citizen science kelp mapping endeavor called Floating Forests.
A method for mapping coral reefs or other benthic habitats over time.
Ways to better estimate the greenhouse gas contributions of wetlands.
Quantifying the impact of historic land-use and hydroclimatic variability on landscape connectivity dynamics across Australia’s breadbasket.
Monitoring surface water trends in North Western Canada.
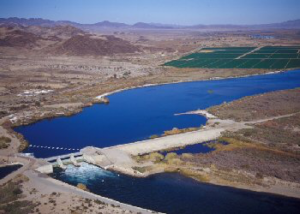
Thirty-one years of observed water use trends in the Southwestern U.S.
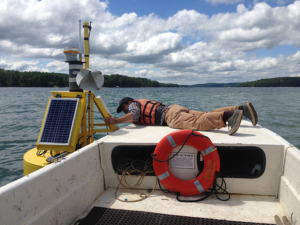
Learn more about a water quality modeling tool known as SPARROW.
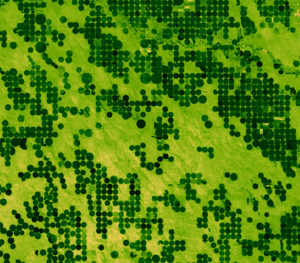
Researchers detail their use of satellite images to produce annual maps of irrigation.
In the first study of its kind, researchers from the University of Maine have demonstrated that Landsat 8 satellite data can be used to find locations where oysters farms should thrive.
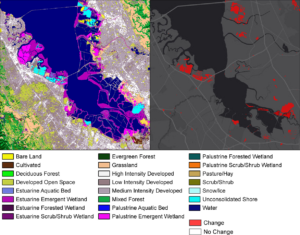
USGS’ pixel-by-pixel land use forecasts offer essential road maps for restoration.
Using 28 years of Landsat data, an Australian research team has created a continent-wide intertidal zone extent map for the whole of the Australian coast.
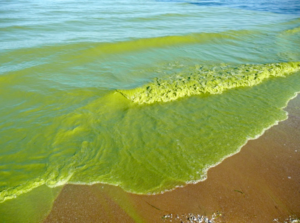
With the growing frequency and magnitude of toxic freshwater algal blooms becoming an increasingly worrisome public health concern, Carnegie scientists Jeff Ho and Anna Michalak, along with colleagues, have made new advances in understanding the drivers behind Lake Erie blooms and their implications for lake restoration.
Drought and reduced seasonal flooding of wetlands and farm fields threaten a globally important stopover site for tens of thousands of migratory shorebirds in California’s Sacramento Valley, a new Duke University-led study shows.
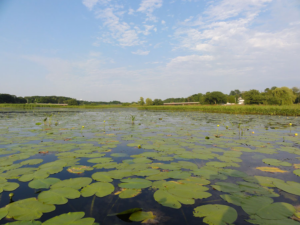
Documenting and protecting wetlands has become crucial to the eight states and two Canadian provinces thronging the Great Lakes.
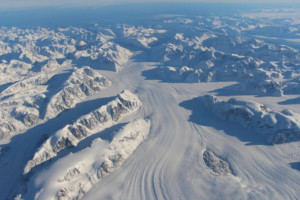
Scientists are providing a near-real-time view of every large glacier and ice sheet on Earth with Landsat 8.
Using Landsat 8 to map the colored dissolved organic matter of inland tropical waters.
The hardwood swamp along the Apalachicola River is slowly replaced by bottomland hardwood forest.
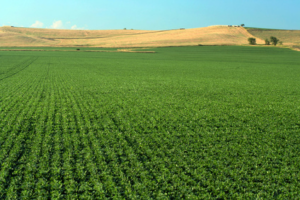
Using Landsat to map croplands over the U.S. High Plains Aquifer.
Understanding the relationship between land use and river flows in the Yarmouk basin.
The water year 2015 peak snowpack was found to be the lowest over the 65-year reconstruction of peak annual snow water equivalent.
A near real-time water resources tracking and decision-support system for the Central Valley of California.
How much has surface water extent varied in space and time through the past 17 years?
How seasonal flooding impacts riparian vegetation in Australia’s Murray Darling Basin.
How the El Niño Southern Oscillation impacts snow cover of a glacierized volcano in Peru.
The number of lakes and water surface area on the Tibetan Plateau has changed much faster than expected.