Managing Water in Conflict-Torn Regions
Understanding the relationship between land use and river flows in the Yarmouk basin.
The avalanching dynamics of meandering rivers.
The water year 2015 peak snowpack was found to be the lowest over the 65-year reconstruction of peak annual snow water equivalent.
A near real-time water resources tracking and decision-support system for the Central Valley of California.
How much has surface water extent varied in space and time through the past 17 years?
How seasonal flooding impacts riparian vegetation in Australia’s Murray Darling Basin.
How the El Niño Southern Oscillation impacts snow cover of a glacierized volcano in Peru.
The number of lakes and water surface area on the Tibetan Plateau has changed much faster than expected.
Developing the largest database of spatial extents for historic floods.
Water use trends observed in the Southwestern U.S. over three decades.
Quantifying changes in global surface waters over the past 32 years.
The world has gained 115,000 km2 of water and 173,000 km2 of land over the past 30 years.
Australia turned to Landsat. At Geoscience Australia, Landsat 8 Science Team member Leo Lymburner works with the flood mapping team headed by Norman Mueller that conceived of the Water Observations from Space project, or WOfS.
Scientists at the University of Georgia’s Marine Institute at Sapelo Island have found that the amount of vegetation along the Georgia coast has declined significantly in the last 30 years, spurring concerns about the overall health of marshland ecosystems in the area.
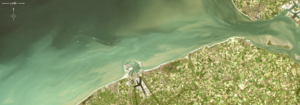
Even with this winter’s strong El Niño, the Sierra Nevada snowpack will likely take until 2019 to return to pre-drought levels, according to new research.
Since record keeping began in 1860, no period has been drier for southeastern Australia than the decade-long Millennium Drought. The lack of rain between 1997 and 2009 led to livestock losses, crop failures, and percentage drops in the Australian GDP.
The BirdReturns program, created by The Nature Conservancy of California, is an effort to provide “pop-up habitats” for some of the millions of shorebirds, such as sandpipers and plovers, that migrate each year from their summer breeding grounds in Alaska and Canada to their winter habitats in California, Mexico, Central and South America.
Water is one of our nation’s most important natural resources, one that’s long been considered inexhaustible. Yet changes in land use, climate, and population demographics are placing unprecedented demands on America’s water supplies. As droughts rage and aquifers dwindle, people may wonder: Is there enough water to meet all our needs?
When a Los Angeles water treatment plant had to discharge treated water closer to shore than usual in the fall of 2015 due to repair work, NASA satellite observations helped scientists from the City of Los Angeles and local research institutions monitor the Santa Monica Bay for any impacts. For the city, it was an opportunity to assess the use of satellites in guiding a substantial monitoring effort. For NASA, it was an opportunity to refine the use of satellite assets to study a coastal environment.
Across the U.S. and particularly in Washington state, very little is known about the acreage, yearly flooding cycles and even the actual locations of wetlands. Even hazier is what could happen to these vital ecosystems under climate change.
Nearshore shipwrecks can leave telltale sediment plumes at the sea’s surface that reveal their location. Using Landsat 8 data, researchers have detected plumes extending as far as 4 kilometers (~2.5 miles) downstream from shallow shipwreck sites. This discovery demonstrates that Landsat and Landsat-like satellites can be used to locate the watery graves of coastal shipwrecks.
NOAA’s Office of Coast Survey has issued provisional charts for barge operators and others traversing Alaska’s challenging Yukon River.
When global food prices spiked dramatically in late 2007 and into 2008, the costs of many basic dietary staples doubled or even tripled around the world, sparking protests and riots. Panicked governments stopped exporting food, aggravating the crisis.
Liheng Zhong, a Senior Delineator with the California Department of Water Resources is working on a way to map rice fields with Landsat to better manage water use. He presented some of this findings at #AGU15, here’s what he shared with us.
Shengli Tao, from Peking University, has used the Landsat data archive to map, measure, and investigate the shrinking lakes of the Mongolian Plateau. We spoke to Tao about the work he presented at #AGU15.
At #AGU15, Amy Hudson, from the University of Maryland College Park, presented a poster about her work to develop a global surface water dynamics map for the years 2000–2014 using data from three Landsat satellites. We spoke with her about this effort.
Joshua Ahmed from Cardiff University studies how river meanders evolve. Using Landsat data to examine river movement through time, his team has made new observations about river channel change. He presented his findings at #AGU15.
Naga Manohar Velpuri, works with the USGS Famine Early Warning Systems Network (FEWS NET). The project has recently initiated a large-scale project to monitor surface water bodies in the pastoral regions of Africa using multi-source satellite data and hydrologic modeling techniques. Currently, a total of 293 water points are being monitored in 10 countries. Velpuri shared some of the projects findings he presented at #AGU15.
Carson Baughman, a geographer at the USGS Alaska Science Center, presented results of his study on seasonal glacial sediment plumes in Alaska’s Lake Clark at #AGU15. We talked to Carson about his work.
A new Landsat-based report from the USGS St. Petersburg Coastal and Marine Science Center takes an integrated look at barrier islands.
Alex Riter, a graduate student at the University of Maryland College Park, presented her finding on how Hurricane Sandy affected New Jersey coastal marches at #AGU15. We talked to Riter about her research.
Sara Lubkin, previously with the NASA DEVELOP program, presented a poster at #AGU15 on her work using Landsat data in concert with MODIS data to measure chlorophyll levels in the Chesapeake Bay. We spoke with Lubkin about her work.
David Selkowitz, a Research Geographer with the USGS Alaska Science Center, and his team have developed a snow cover product, that allows users to look at historical snow cover through time. Selkowitz presented a poster on the Landsat-based data product at #AGU15. Here’s what we learned from him this week.