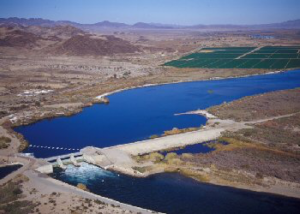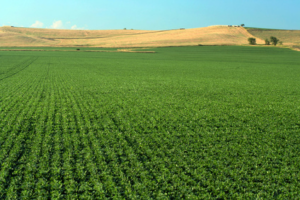
Farm Crops for City Drops: Assessing Water Right Transfers With Landsat
Thirty-one years of observed water use trends in the Southwestern U.S.

Thirty-one years of observed water use trends in the Southwestern U.S.
Learn more about a water quality modeling tool known as SPARROW.

Uncharted, a cartographic art installation, was on display for the 2017 Pecora 20 in Sioux Falls, South Dakota.
To learn how current investments could impact the future of Landsat we are conducting a series of interviews with ESTO-funded researchers working on technology for the Landsat 10 era and beyond.
Each day of 2017, a project called Landsat365 is sharing a stunning Landsat 8 image with the public.
Descartes Labs released a 3.1-trillion pixel, cloud-free Landsat 8 composite image of the world along with two others based on the European Union’s Sentinel satellites on Feb. 6, 2017.
Using Landsat 8 to map the colored dissolved organic matter of inland tropical waters.
Using Landsat 8 to create three-dimensional maps of volcanic ash plumes.
The hardwood swamp along the Apalachicola River is slowly replaced by bottomland hardwood forest.
What edge effect means for U.S. southeastern forests.

Using Landsat to map croplands over the U.S. High Plains Aquifer.
Understanding the relationship between land use and river flows in the Yarmouk basin.

An approach for evaluating brush management conservation.
The avalanching dynamics of meandering rivers.
A new a tool to help with annual forest mapping.
The water year 2015 peak snowpack was found to be the lowest over the 65-year reconstruction of peak annual snow water equivalent.
Using Landsat time-series analysis to map glaciers.
A near real-time water resources tracking and decision-support system for the Central Valley of California.
How much has surface water extent varied in space and time through the past 17 years?
How seasonal flooding impacts riparian vegetation in Australia’s Murray Darling Basin.
Looking at the causes of carbon loss in Pacific Northwest forests.
A Landsat-based continuous mapping method to enable better forest management.
How the urban heat island of Boston affects the growing season of vegetation in and around the city.
We know very little about cities worldwide. In many instances we have little idea about the use and morphology of cities.
The extensive Landsat record has been analyzed to map the climatalogical normal date of snowmelt for large areas of the Arctic.
In May 2015, a severe glacier surge struck the eastern Pamir.
How the El Niño Southern Oscillation impacts snow cover of a glacierized volcano in Peru.
The glaciers of Puncak Jaya have continued their decline.
Imagery, like Landsat’s, offers an overhead view to NWS personnel.
A new indicator of fire risk for peat moss environments that relys on Landsat 8’s new blue band.
The carbon implications of 45 years of land use and land cover change in the conterminous U.S.
The number of lakes and water surface area on the Tibetan Plateau has changed much faster than expected.
A new collaborative platform has been developed to help Vietnam plan for and respond to flooding.